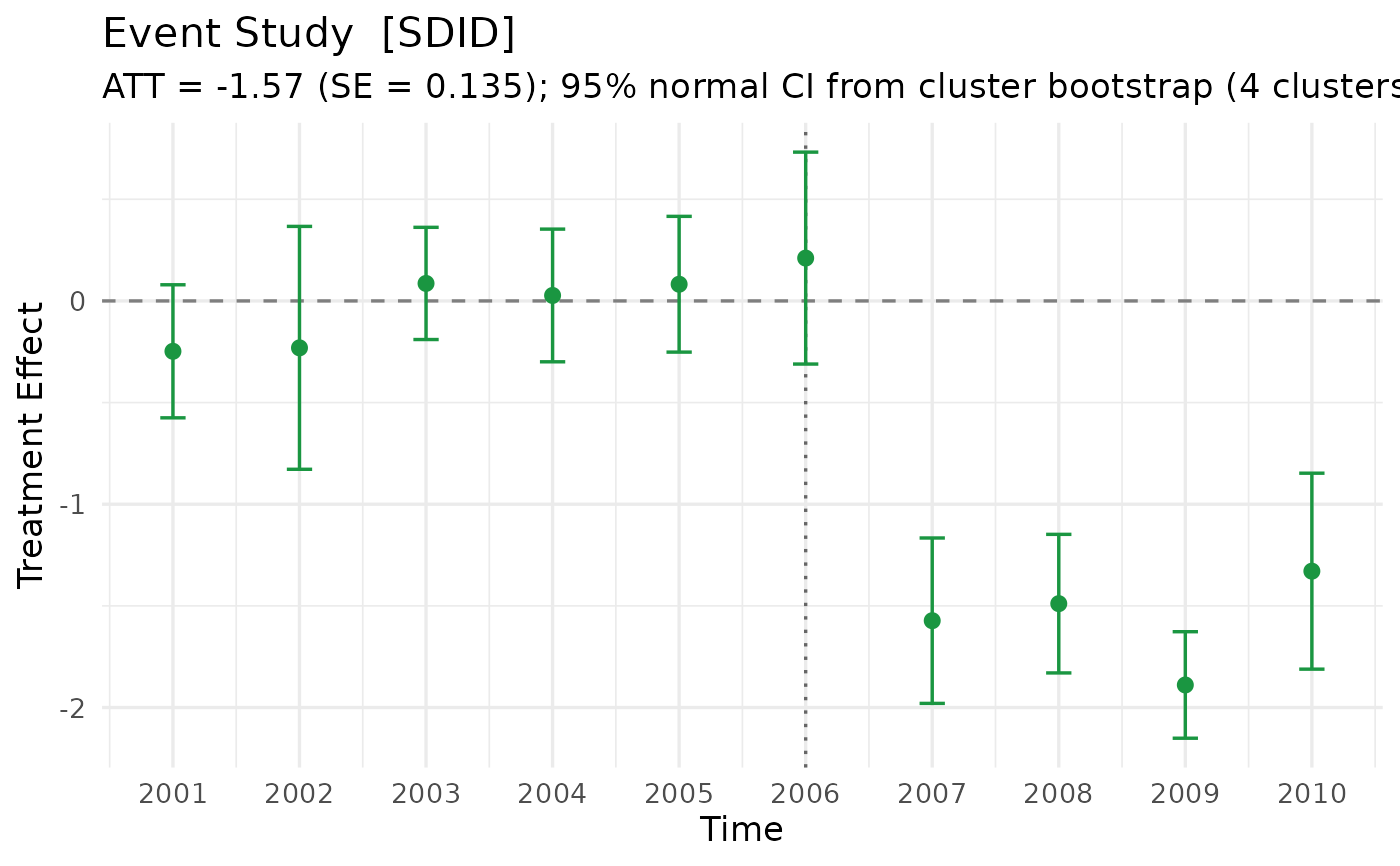
Computes period-by-period treatment effects (event-study series) for a sharp
Synthetic Difference-in-Differences fit, aligned on the
\(\hat\lambda\)-weighted pre-treatment gap so that the post-treatment mean
of the period effects equals the SDID ATT (fit$estimate) exactly, together
with bootstrap standard errors and confidence intervals (both normal
approximation and percentile) for every period and for the overall ATT from
the same bootstrap draws.
Usage
sdid_event_study(
  fit,
  cluster = NULL,
  data = NULL,
  n_boot = 200L,
  level = 0.95,
  ci_type = c("normal", "percentile"),
  seed = NULL
)
Arguments
- fit
A sharp
coresynthobject fitted withmethod = "sdid". Staggered fits are not supported and raise an error.- cluster
Cluster specification for block/cluster bootstrap resampling (e.g. prefecture or state):
NULL(default): resample individual units (both treated and control) with replacement.A single character string naming a column in
data(or a one-sided formula~ col), in which casedatamust also be supplied.A named vector whose names are unit IDs matching the units in
fitand whose values give each unit's cluster ID.
Unnamed positional vectors are rejected to prevent silent misalignment between row/column order and unit IDs.
- data
Optional
data.framecontaining the unit identifier column and theclustercolumn whenclusteris given as a column name.- n_boot
Integer number of bootstrap replications (default
200L). Setn_boot = 0L(orNULL) to skip the bootstrap and return point estimates only.- level
Confidence level for the intervals (default
0.95).- ci_type
Which confidence interval type (
"normal"or"percentile") to populateconf.lowandconf.highwith intidy(),glance(), andplot()by default. Both normal-approximation (ci_norm_lower,ci_norm_upper) and percentile (ci_pct_lower,ci_pct_upper) intervals are always computed and stored.- seed
Optional integer seed for reproducible bootstrap resampling.
Value
An object of class "sdid_event_study" (a named list) containing:
terms: Adata.framewith one row per period (time,event_time,period("pre"/"post"),estimate,se,ci_norm_lower,ci_norm_upper,ci_pct_lower,ci_pct_upper,conf.low,conf.high).mean(terms$estimate[terms$period == "post"])equalsestimate(ATT).estimate: Overall SDID ATT (fit$estimate).se: Bootstrap standard error of the ATT (sd(boot_att)).p_value: Two-sided normal-approximation p-value for the ATT.ci_norm_lower,ci_norm_upper: Normal-approximation CI for the ATT.ci_pct_lower,ci_pct_upper: Percentile CI for the ATT.ci_lower,ci_upper: ATT CI bounds matchingci_type.ci_type: Resolved default CI type ("normal"or"percentile").level: Confidence level.n_boot: Requested number of bootstrap draws.n_boot_valid: Number of valid bootstrap draws completed.n_boot_dropped: Number of draws discarded (empty treated/control group or solver failure).clustered: Logical;TRUEwhenclusterwas supplied.n_clusters: Number of unique clusters (or total units when unclustered).n_treated: Number of treated units infit.n_controls: Number of control units infit.times: Time index vector (fit$times).T_pre: Number of pre-treatment periods (fit$T_pre).boot_gaps: Numeric matrix of dimensionn_boot_valid x Tholding the aligned period-by-period gap series for each valid bootstrap draw (colnames areas.character(times)), orNULLwhenn_boot == 0.boot_att: Numeric vector of lengthn_boot_validholding the ATT for each valid draw (identical torowMeans(boot_gaps[, (T_pre + 1):T])), orNULLwhenn_boot == 0.
Details
Resampling scheme: As in sdid_inference() with method = "bootstrap"
(Arkhangelsky et al. 2021, Algorithm 2), sdid_event_study() resamples
both treated and control units with replacement – here at the cluster
level when cluster is supplied, or at the unit level when
cluster = NULL – and reports period-by-period effects as well as the
ATT. Duplicated units in a
bootstrap draw enter as distinct unit columns (equivalent to assigning fresh
unit IDs per draw), and \(\hat\sigma^2\), \(\zeta^2\) (unless user-fixed in
scm_fit()), unit weights \(\hat\omega\), and time weights \(\hat\lambda\) are
all re-estimated on each draw. Draws in which either the resampled treated
group or the resampled control group has zero units (or fewer than two
control units) are discarded; the counts of valid and discarded draws are
reported in n_boot_valid and n_boot_dropped.
Pre-treatment period coefficients are returned and plotted for visual inspection of pre-trends only; no joint Wald test is performed because the pre-treatment gaps are constrained by the \(\hat\omega\) and \(\hat\lambda\) weights and their covariance matrix can be singular.
Examples
set.seed(1)
panel <- expand.grid(unit = 1:12, year = 2001:2010)
panel$pref <- paste0("pref_", (panel$unit - 1) %% 4 + 1)
panel$d <- as.integer(panel$unit <= 3 & panel$year >= 2007)
panel$y <- panel$unit + 0.5 * (panel$year - 2000) +
rnorm(nrow(panel), sd = 0.3) - 1.5 * panel$d
fit <- scm_fit(y ~ d | unit + year, data = panel, method = "sdid")
es <- sdid_event_study(fit, cluster = "pref", data = panel,
n_boot = 50, seed = 42)
es
#> === SDID Event Study (cluster bootstrap, 4 clusters) ===
#> ATT Estimate : -1.57
#> ATT SE : 0.1353
#> p-value : < 1e-04
#> 95% CI (norm): [-1.8353, -1.3048]
#> 95% CI (pct) : [-1.9090, -1.3526]
#> Bootstrap : 50 valid / 50 requested (0 discarded)
#>
#> Period-by-period effects (lambda-aligned; post-period mean = ATT):
#> time period estimate se ci_norm_lower ci_norm_upper ci_pct_lower
#> 2001 pre -0.2478 0.1670 -0.5750 0.0794 -0.7314
#> 2002 pre -0.2308 0.3048 -0.8282 0.3665 -0.6683
#> 2003 pre 0.0860 0.1408 -0.1899 0.3619 -0.1722
#> 2004 pre 0.0268 0.1665 -0.2995 0.3531 -0.2358
#> 2005 pre 0.0820 0.1703 -0.2518 0.4159 -0.3415
#> 2006 pre 0.2106 0.2659 -0.3106 0.7318 -0.1574
#> 2007 post -1.5728 0.2075 -1.9796 -1.1661 -1.8904
#> 2008 post -1.4890 0.1739 -1.8298 -1.1482 -1.9003
#> 2009 post -1.8890 0.1337 -2.1509 -1.6270 -2.0845
#> 2010 post -1.3293 0.2459 -1.8112 -0.8474 -1.9274
#> ci_pct_upper
#> 0.0137
#> 0.3890
#> 0.3809
#> 0.3698
#> 0.3422
#> 0.7224
#> -1.0800
#> -1.1575
#> -1.5637
#> -0.8558
broom::tidy(es)
#> time event_time period estimate std.error conf.low conf.high
#> 1 2001 -6 pre -0.24782666 0.1669505 -0.5750436 0.0793903
#> 2 2002 -5 pre -0.23082454 0.3047693 -0.8281615 0.3665124
#> 3 2003 -4 pre 0.08600379 0.1407890 -0.1899376 0.3619452
#> 4 2004 -3 pre 0.02683772 0.1664804 -0.2994578 0.3531333
#> 5 2005 -2 pre 0.08204119 0.1703369 -0.2518129 0.4158953
#> 6 2006 -1 pre 0.21062669 0.2659272 -0.3105810 0.7318344
#> 7 2007 0 post -1.57284709 0.2075459 -1.9796296 -1.1660646
#> 8 2008 1 post -1.48899791 0.1738763 -1.8297892 -1.1482066
#> 9 2009 2 post -1.88898248 0.1336520 -2.1509356 -1.6270294
#> 10 2010 3 post -1.32930106 0.2458848 -1.8112264 -0.8473758
#> ci_norm_lower ci_norm_upper ci_pct_lower ci_pct_upper
#> 1 -0.5750436 0.0793903 -0.7313559 0.01366954
#> 2 -0.8281615 0.3665124 -0.6682882 0.38901647
#> 3 -0.1899376 0.3619452 -0.1722406 0.38091707
#> 4 -0.2994578 0.3531333 -0.2357820 0.36984832
#> 5 -0.2518129 0.4158953 -0.3415019 0.34220943
#> 6 -0.3105810 0.7318344 -0.1574213 0.72242913
#> 7 -1.9796296 -1.1660646 -1.8903653 -1.08003971
#> 8 -1.8297892 -1.1482066 -1.9003357 -1.15754682
#> 9 -2.1509356 -1.6270294 -2.0844596 -1.56372942
#> 10 -1.8112264 -0.8473758 -1.9273740 -0.85579826
# \donttest{
plot(es)
 # }