
Visualizes the placebo study returned by mspe_ratio_pval(), following
Abadie, Diamond & Hainmueller (2010, Section 3.4).
Arguments
- x
A
scm_placeboobject frommspe_ratio_pval().- type
One of
"gaps"(ADH 2010, Figures 4-7) or"ratios"(ADH 2010, Figure 8).- mspe_prune
Exclude placebo units whose pre-treatment MSPE exceeds
mspe_prunetimes the treated unit's.NULL(default) reuses the cutoffmspe_ratio_pval()computed the p-value under, so the picture and the test describe the same set of placebo runs;Infkeeps every run whatever the test did. A rule stated on the RMSPE scale, such as tidysynth's "2 times the treated unit's pre-period RMSPE", corresponds to the squared multiple (mspe_prune = 4).- colors
A named vector overriding series colors, e.g.
c(treated = "black"). Valid keys:"treated","placebo".- labels
A named vector overriding the legend text of individual series, e.g.
c(treated = "California"). Valid keys:"treated","placebo". Series not mentioned keep their default label;colorsandlabelsaddress series by the same keys, independent of the displayed legend text.- linetypes
Only for
type = "gaps": a named vector overriding the line type of individual series, e.g.c(placebo = "dotted"). Valid keys:"treated","placebo"(both default to"solid"). Values areggplot2line type names ("solid","dashed","dotted","dotdash","longdash","twodash","blank") or the equivalent integer codes0:6. Series are addressed by the same keys ascolorsandlabels. Ignored fortype = "ratios"(points, not lines).- vline
Only for
type = "gaps": aesthetic overrides for the vertical treatment-time line, as a list passed toggplot2::geom_vline().NULLorFALSEhides the line entirely. The list may also carry anxinterceptelement giving one or more absolute positions on the time axis, replacing the default treatment-time position.- vline_offset
Only for
type = "gaps": where to draw the vertical treatment line, in periods relative to the first post-treatment period. The default-1puts the line on the last pre-treatment period;0moves it onto the first post-treatment period, and fractional values interpolate between adjacent observed times. Cannot be combined with anxinterceptelement invline.- hline
Only for
type = "gaps": aesthetic overrides for the horizontal zero line, as a list passed toggplot2::geom_hline().NULLorFALSEhides the line entirely.- ...
Ignored.
Details
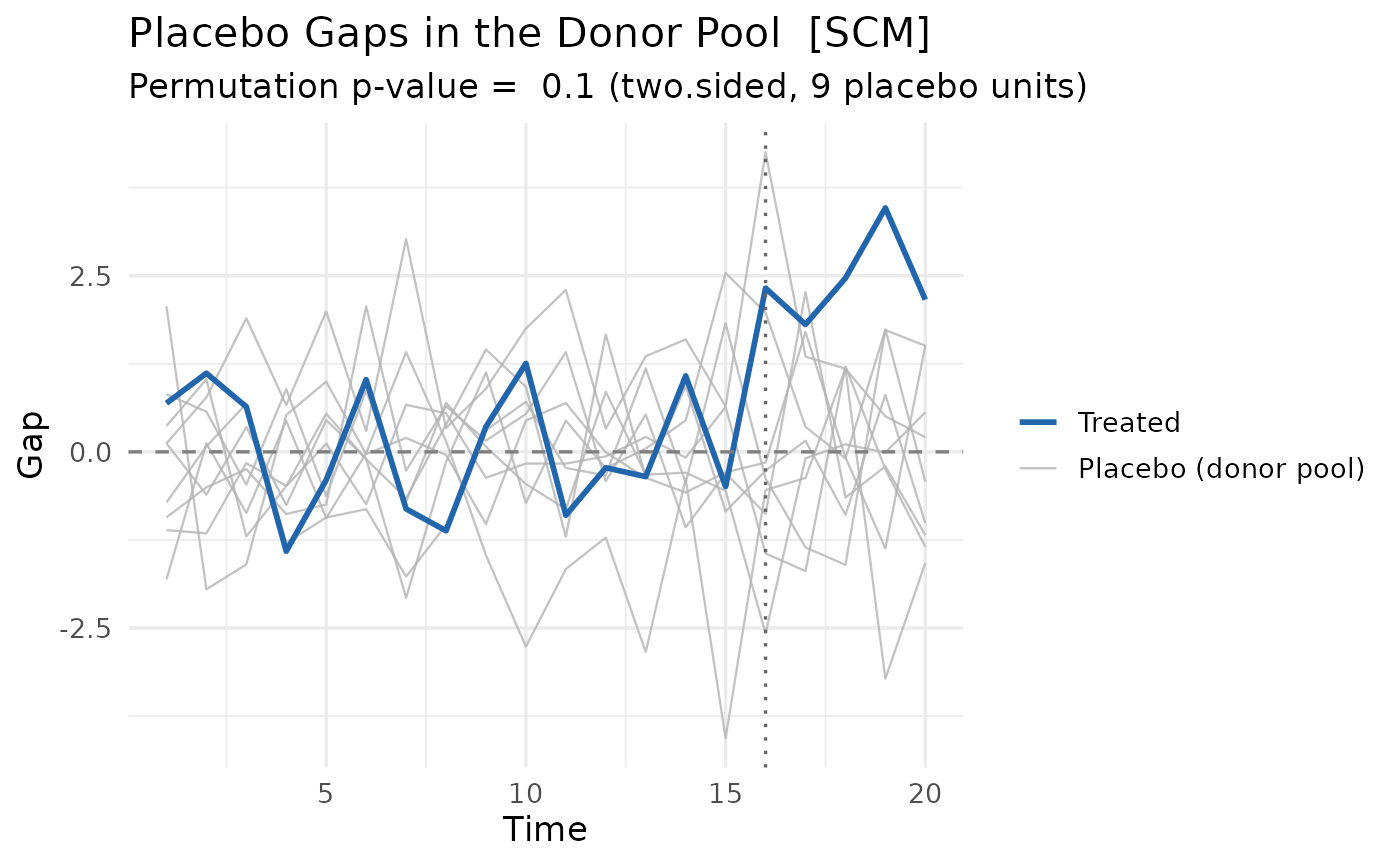
type = "gaps" overlays the treated unit's gap path (treated minus
synthetic control) on the placebo gap paths obtained by reassigning the
intervention to each donor unit (ADH 2010, Figure 4). Placebo units whose
synthetic control fits poorly before treatment carry no information about
the rarity of a large post-treatment gap, so ADH exclude units whose
pre-treatment MSPE exceeds a multiple of the treated unit's: 20, 5, and 2
in their Figures 5-7 (mspe_prune).
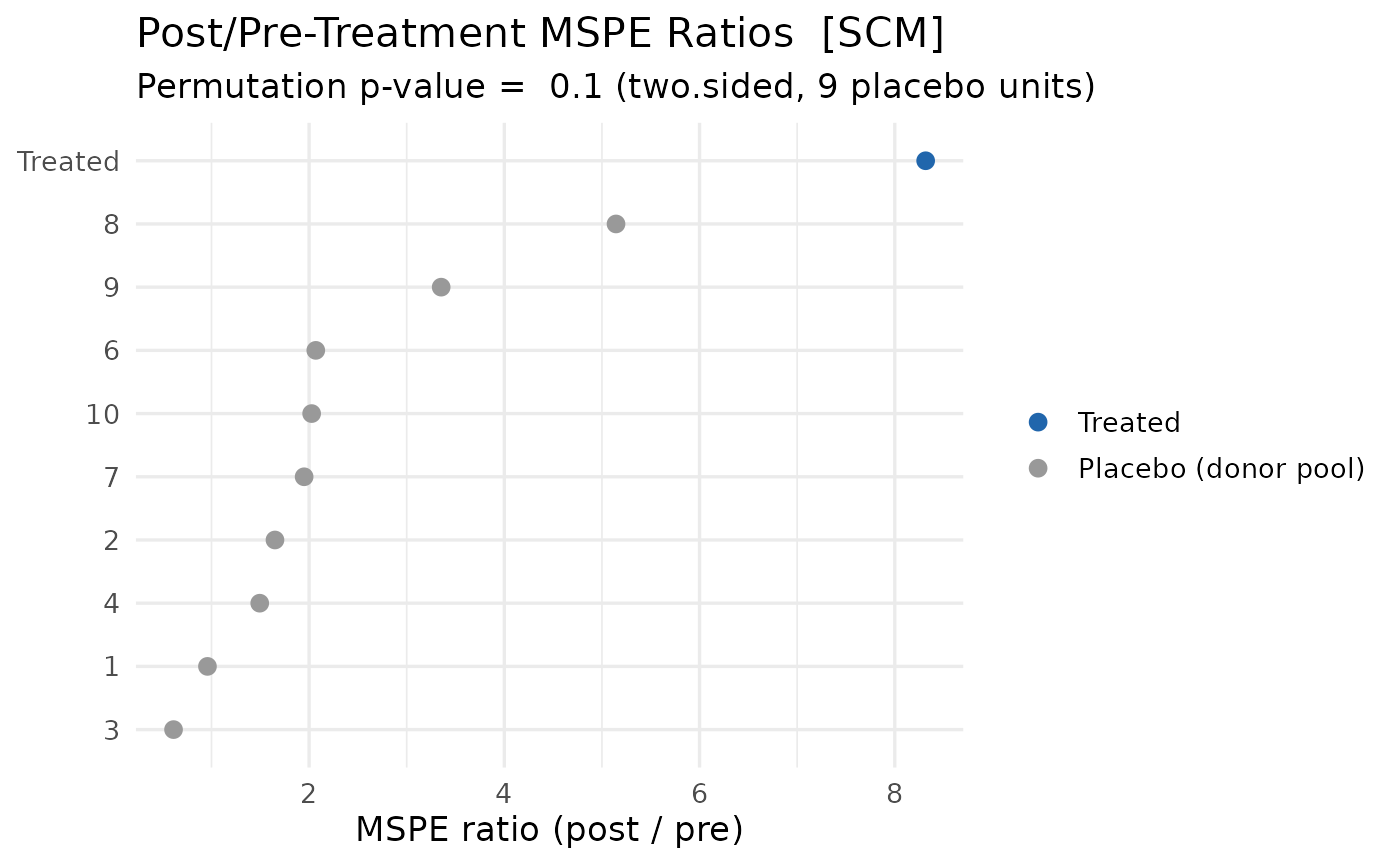
type = "ratios" shows the statistic behind the two-sided permutation
p-value, one point per unit (ADH 2010, Figure 8): the post/pre-treatment
MSPE ratio, or the post-treatment MSPE where the test was run with
statistic = "post_mspe". The ratio needs no pruning cutoff by
construction, which is why mspe_ratio_pval() leaves mspe_prune at
Inf; where the test did prune, the same runs are dropped here so that the
points and the p-value in the subtitle describe one set of placebo runs.
Examples
set.seed(1)
panel <- expand.grid(unit = 1:10, year = 1:20)
panel$treated <- as.integer(panel$unit == 5 & panel$year > 15)
panel$gdp <- panel$unit + 0.5 * panel$year +
rnorm(nrow(panel)) + 3 * panel$treated
fit <- scm_fit(gdp ~ treated | unit + year, data = panel, method = "scm")
#> predictors = NULL: using the outcome in each of the 15 pre-treatment periods as predictors (outcomes-only SCM).
placebo <- mspe_ratio_pval(fit)
# \donttest{
# Treated gap overlaid on the donor-pool placebo gaps (ADH 2010, Fig. 4)
plot(placebo, type = "gaps")
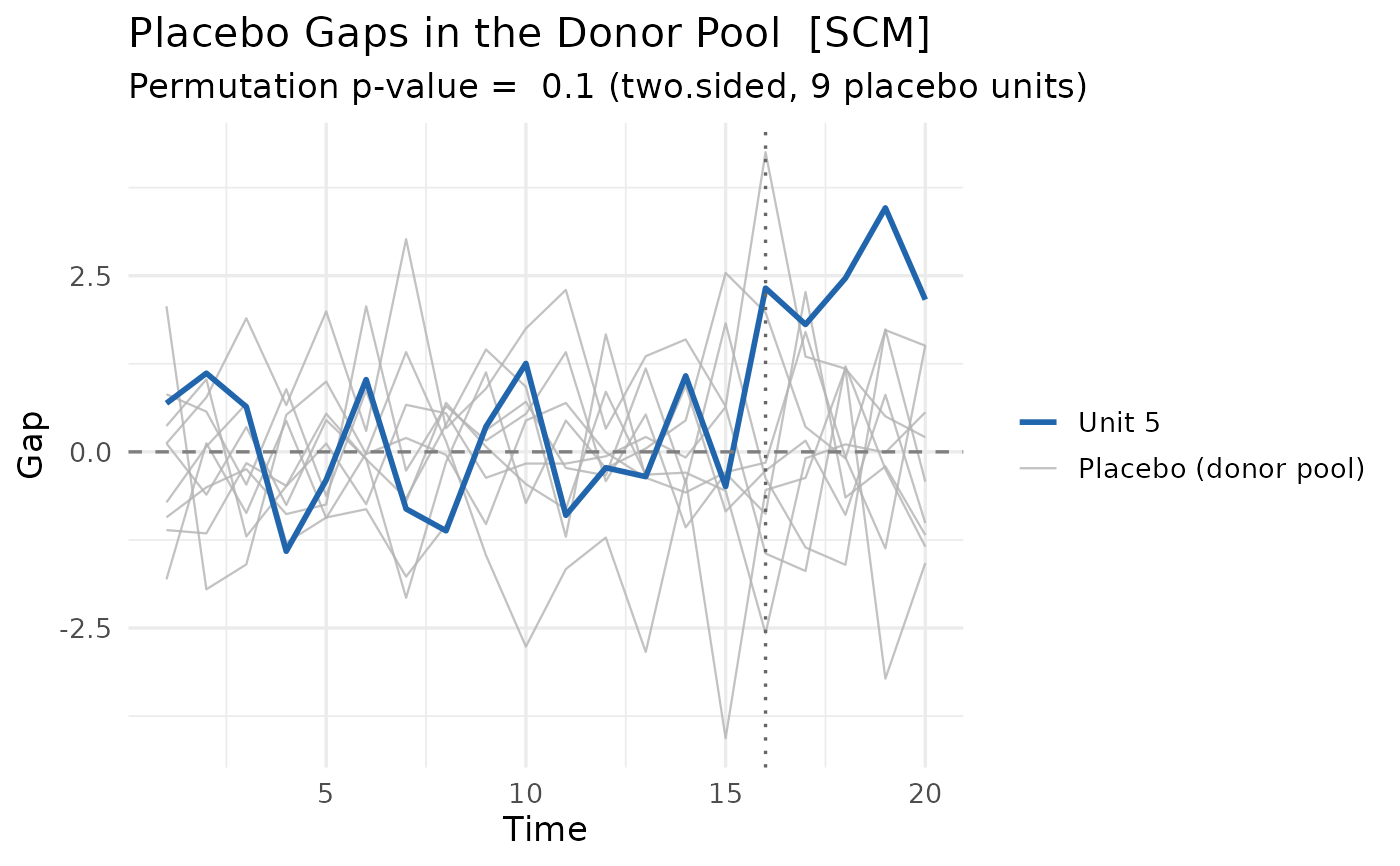
 # Prune poorly fitting placebos and relabel the legend
plot(placebo, type = "gaps", mspe_prune = 5,
labels = c(treated = "Unit 5"))
# Prune poorly fitting placebos and relabel the legend
plot(placebo, type = "gaps", mspe_prune = 5,
labels = c(treated = "Unit 5"))
 # Set the line type of the placebo paths off against the treated one
plot(placebo, type = "gaps", linetypes = c(placebo = "dotted"))
# Set the line type of the placebo paths off against the treated one
plot(placebo, type = "gaps", linetypes = c(placebo = "dotted"))
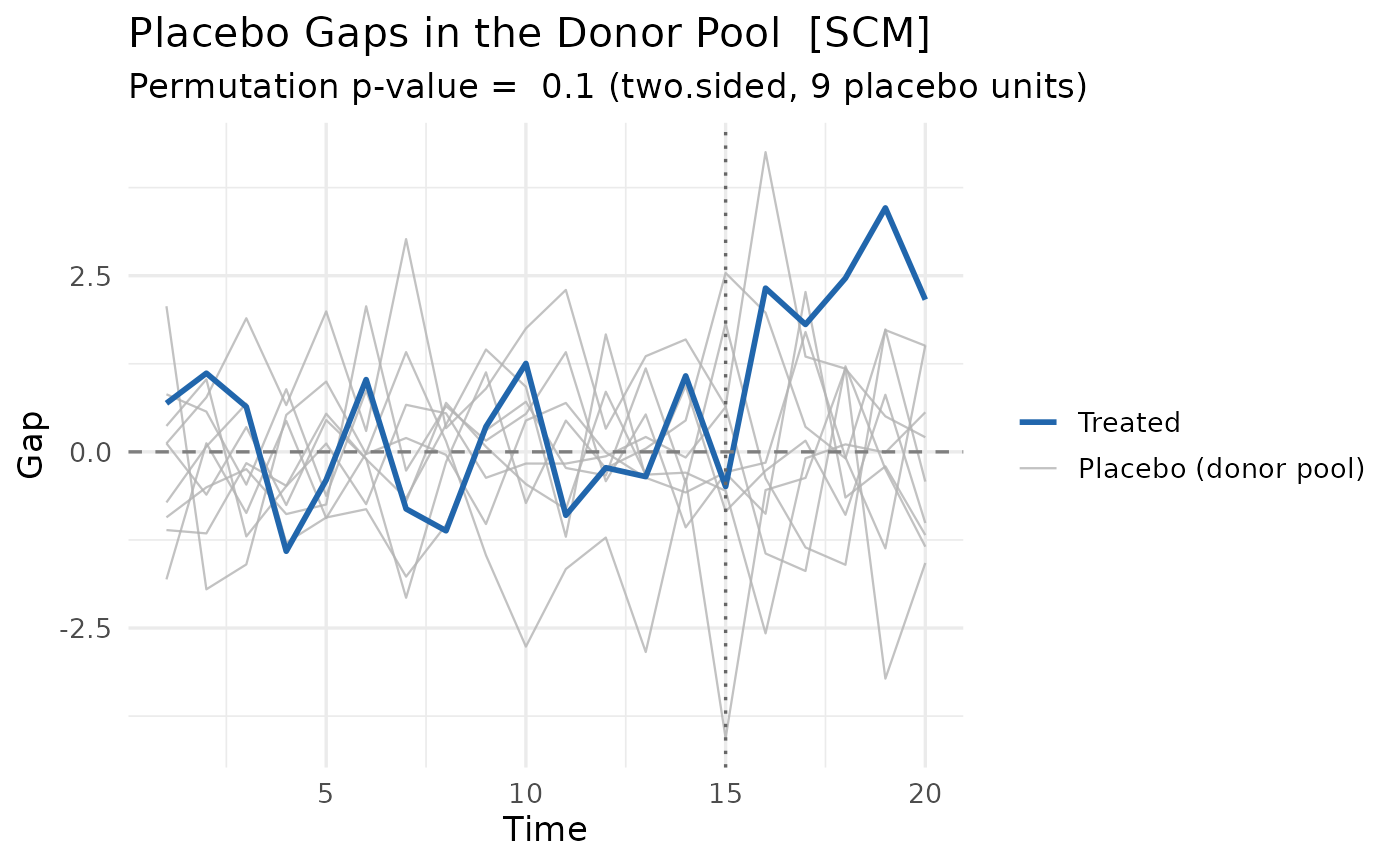 # Move the treatment line onto the first post-treatment period
plot(placebo, type = "gaps", vline_offset = 0)
# Move the treatment line onto the first post-treatment period
plot(placebo, type = "gaps", vline_offset = 0)
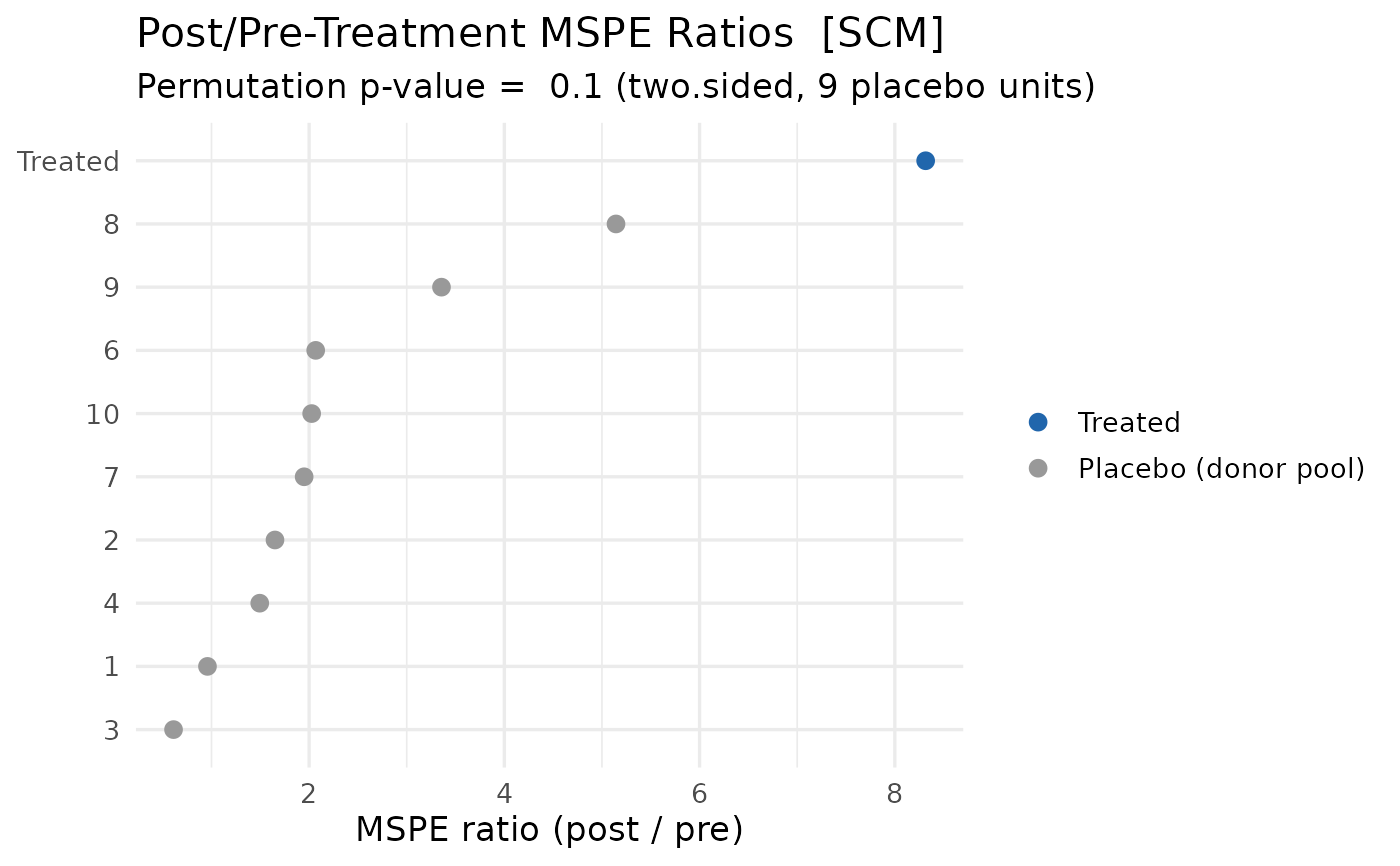 # Post/pre-treatment MSPE ratios (ADH 2010, Fig. 8)
plot(placebo, type = "ratios")
# Post/pre-treatment MSPE ratios (ADH 2010, Fig. 8)
plot(placebo, type = "ratios")
 # }
# }