
Overview
fixes is an R package for event studies and inference in difference-in-differences designs with panel data. It runs the classic two-way fixed-effects (TWFE) event study as well as estimators for staggered adoption, and covers four stages of a DiD workflow:
| Stage | Function | What it does |
|---|---|---|
| 1. Event study | event_study() |
Dynamic treatment effects by relative time (6 estimators) |
| 2. ATT aggregation | att() |
Aggregated ATT — overall, by cohort, by calendar time |
| 3. Basic DiD | did() |
Single-coefficient TWFE DiD with modelsummary support |
| 4. Sensitivity | honest_sensitivity() |
Robust inference under violations of parallel trends (Rambachan & Roth 2023) |
| Visualisation | plot() |
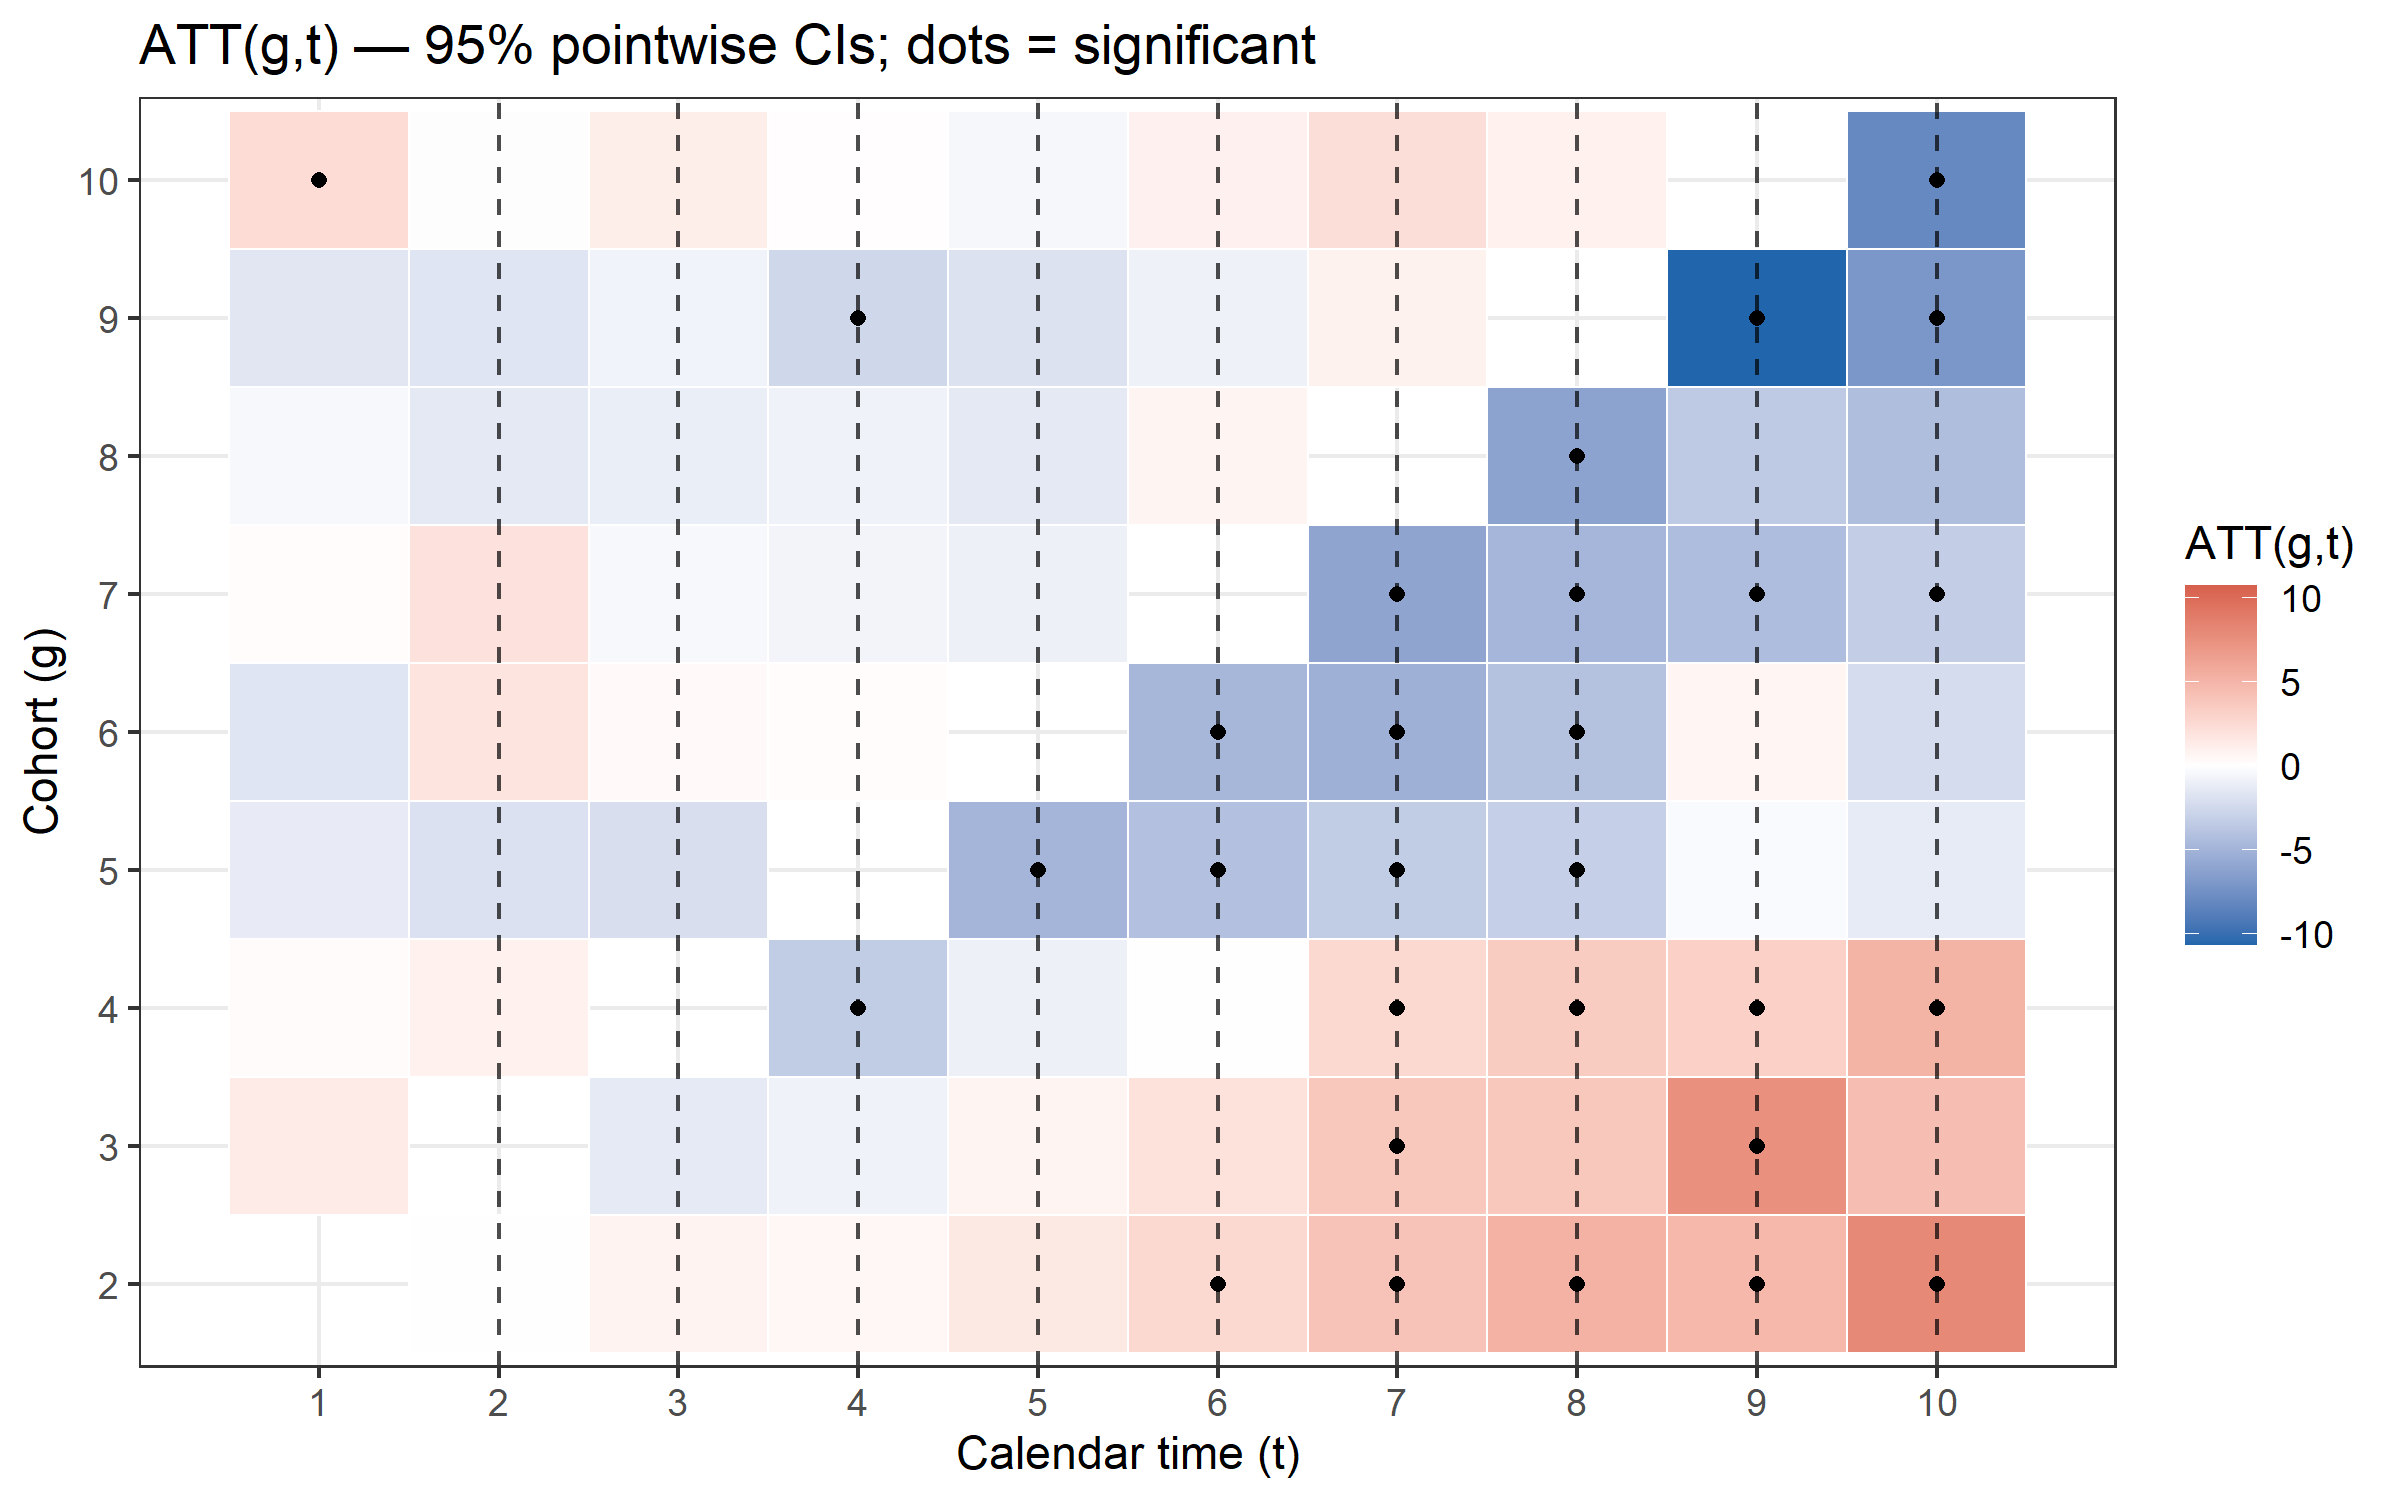
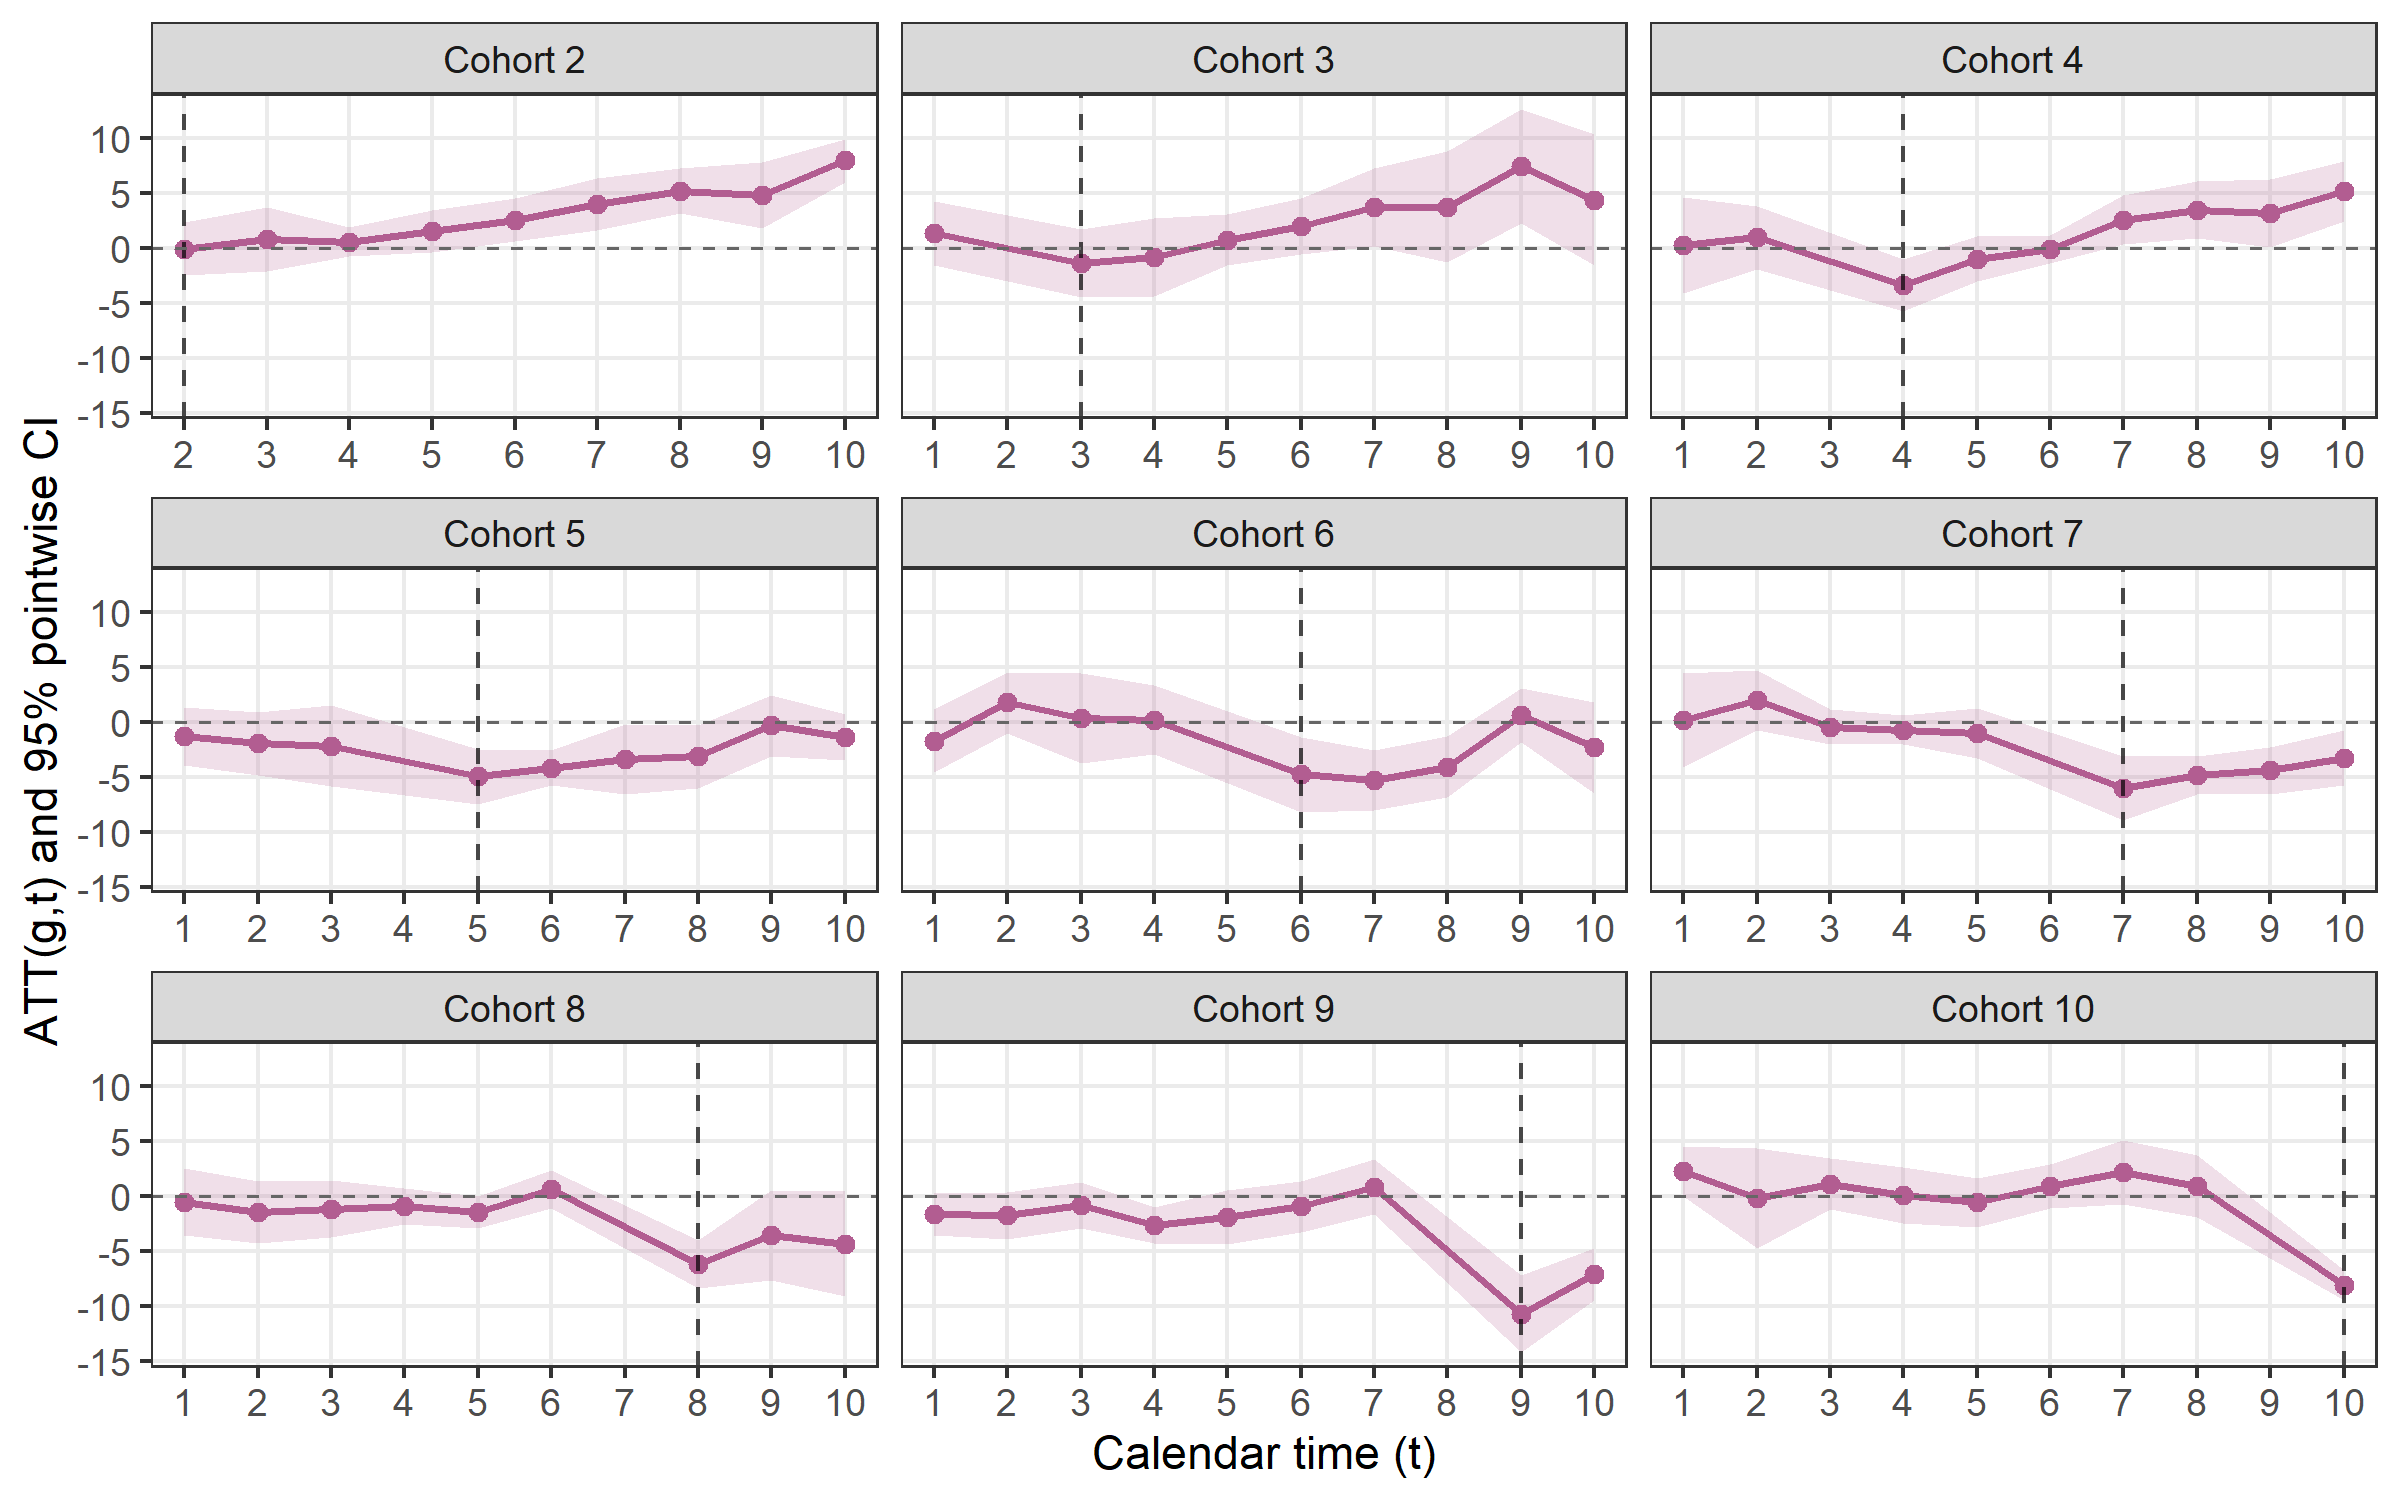
Every result has a base plot() method (ggplot2); plot(x, interactive = TRUE) gives a plotly chart, plot(att_gt(x)) the ATT(g,t) heatmap/facets |
Estimation runs on the package’s internal C++ fixed-effects OLS engine — fixest is an optional (suggested) dependency, not a requirement.
Upgrading from < 1.0.0? The verb-style API (
run_es(),calc_att(),run_did(),plot_es(), …) still works and returns identical results, but is deprecated. SeeNEWS.mdfor the old-to-new mapping.
Estimators (selected via the estimator argument in event_study() and att()):
estimator |
Reference | Best for |
|---|---|---|
"twfe" |
Classic TWFE | Universal treatment timing |
"cs" |
Callaway & Sant’Anna (2021) | Staggered adoption |
"sa" |
Sun & Abraham (2021) | Staggered adoption |
"bjs" |
Borusyak, Jaravel & Spiess (2024) | Staggered adoption |
"twm" |
Wooldridge (2025) | Staggered adoption; optional cohort trends |
"flex" |
Deb, Norton, Wooldridge & Zabel (2024) | Repeated cross-section data |
Installation
# From CRAN
install.packages("fixes")

# Development version
pak::pak("yo5uke/fixes")
Quick start
Every estimation function takes the same model formula, outcome ~ treatment + covariates | fixed effects, as in fixest::feols(). Swap the function to get a different summary of the same design:
did(y ~ D | id + year, data = df)                        # one DiD coefficient
event_study(y ~ D | id + year, data = df, time = year)   # effects by event time
att(y ~ D | id + year, data = df, time = year)           # aggregated staggered ATT
Specifying treatment
Describe treatment in whichever way matches your data:
| Your data has | Write |
|---|---|
| D: 1 for treated units in post-treatment periods | y ~ D + x \| id + year, time = year |
each unit’s first treated period (NA = never treated) |
y ~ x \| id + year, time = year, timing = g |
| a treated-group dummy and one treatment date | y ~ treated + x \| id + year, time = year, timing = 2005 |
- With a D column, each unit’s treatment start is the first period with
D = 1, so you never build event time or cohorts yourself. - With a timing column, the right-hand side holds only covariates (
y ~ 1 | id + yearwhen there are none). -
timeis required byevent_study()andatt(). The unit is read from the fixed effects (| id + yearwithtime = year) and reported in a message; passunit = idto set it yourself.print()shows both.
The argument interface (
outcome =,treatment =,fe =,covariates =) still works in fixes 1.x with a deprecation warning that prints the equivalent formula call; fixes 2.0.0 is planned to accept only the formula.
Basic DiD — did()
For a simple two-way FE DiD with a single treatment coefficient, use did(). Output is fully compatible with modelsummary::modelsummary() and tinytable::tt().
# D column
res <- did(y ~ D | id + year, data = df)

# treated-group dummy and treatment date: did() builds D = treated * (year >= 2006)
res <- did(y ~ treated | id + year, data = df, time = year, timing = 2006)
Either way the result is a did_result object:
df <- fixest::base_did

# Build a universal-timing DiD dataset
df$D <- as.integer(df$treat == 1 & df$period >= 5)

res <- did(y ~ D | id + period, data = df, cluster = ~ id)

print(res)
## DiD Estimation [TWFE]
## N = 1080 obs | 330 treated obs
## FE: id + period
## VCOV: cluster | Cluster: id
##
## term estimate std.error statistic p.value
## 1 D 4.5 0.544 8.27 3.94e-13did() integrates with the broom and modelsummary ecosystems:
broom::tidy(res)          # all coefficients (treatment + any covariates)
broom::glance(res)        # nobs, within R², AIC, ...
modelsummary::modelsummary(res)   # regression table via tinytable
Event study — event_study()
All six estimators share the same interface.
Classic TWFE (single treatment date)
Use event_study() with a fixed event date. Here we use fixest::base_did, a balanced panel where all units are treated at period 5.
es <- event_study(
  y ~ treat | id + period,
  data     = df,
  time     = period,
  timing   = 5,
  cluster  = ~ id,
  baseline = -1
)

print(es)
## Event Study Result (fixes)
## N: 1080 | Units: 108 | Treated units: 55 | Never-treated: 53
## Panel: unit = id | time = period
## FE: id + period
## VCOV: cluster | Cluster: id
## Estimator: twfe
## Method: classic | lead_range: 4 lag_range: 5 baseline: -1
plot(es)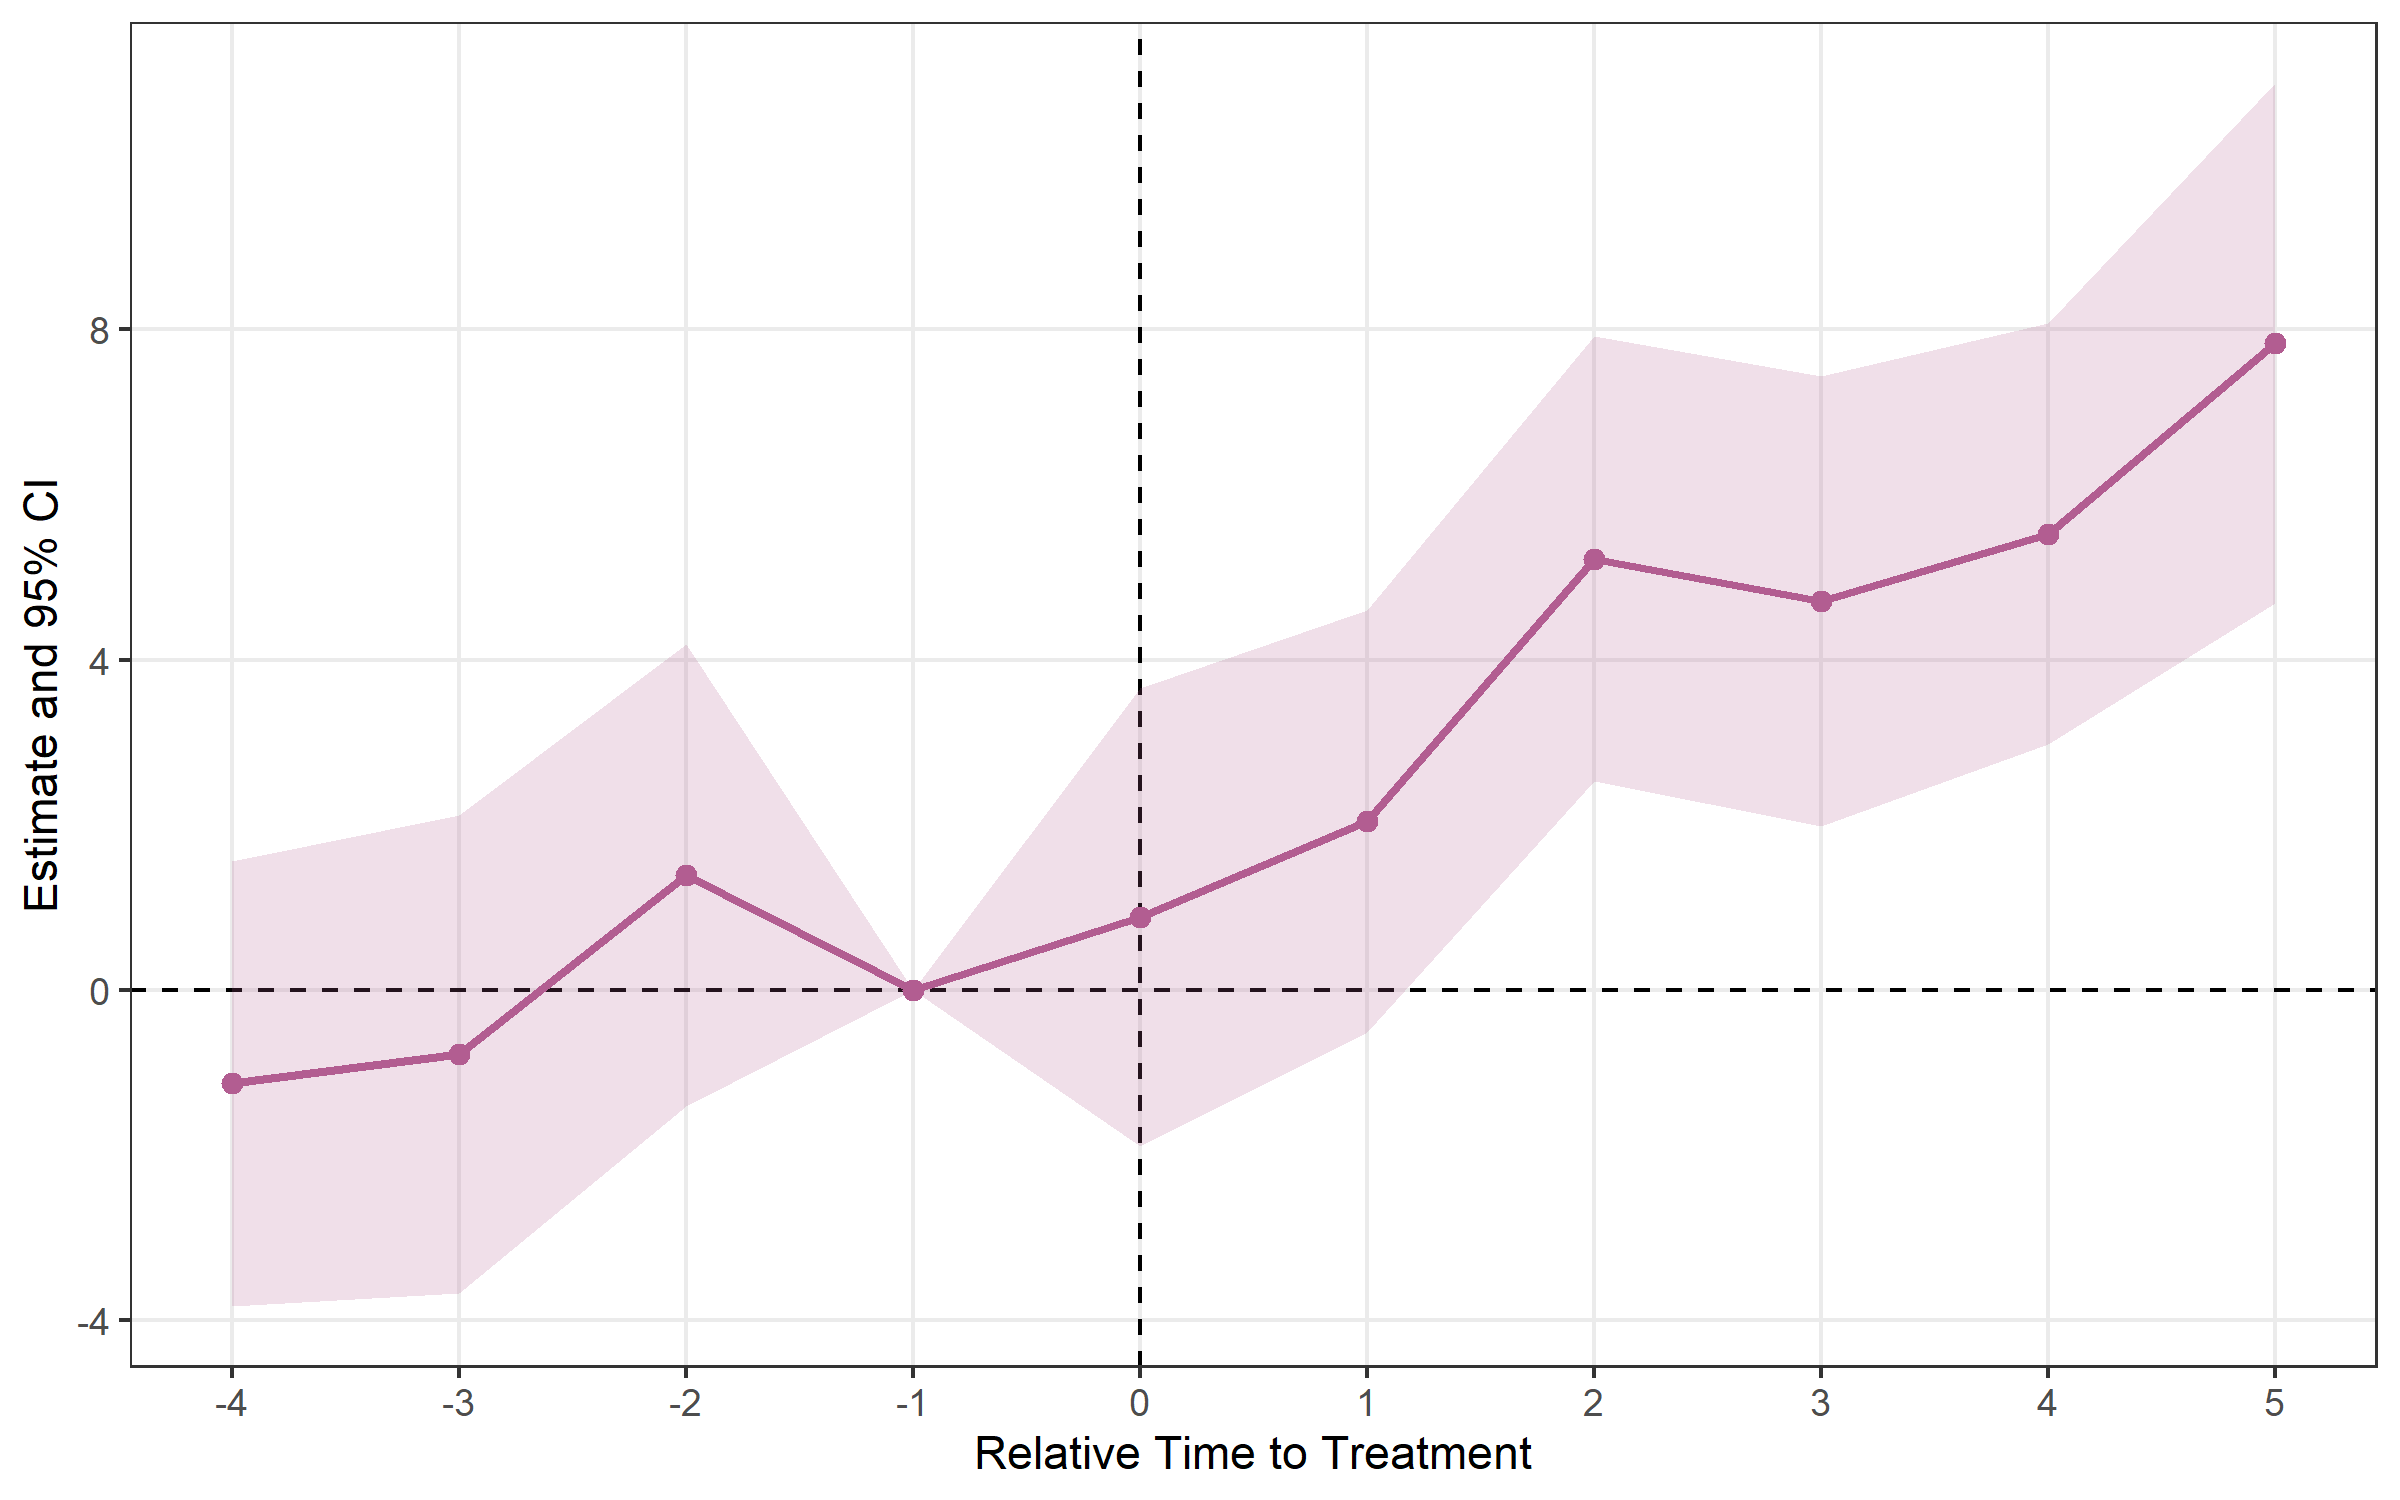
Staggered adoption
When units adopt treatment at different times, the classic TWFE estimator can be biased. fixes provides modern alternatives.
Setup: fixest::base_stagg — never-treated units have NA timing.
df_stagg <- fixest::base_stagg
df_stagg$timing <- df_stagg$year_treated
df_stagg$timing[df_stagg$year_treated == 10000] <- NA
The examples below pass this timing column. If your data holds a treatment indicator instead, put it in the formula and drop timing; each unit’s start is read off it:
df_stagg$D <- as.integer(!is.na(df_stagg$timing) & df_stagg$year >= df_stagg$timing)
event_study(y ~ D | id + year, data = df_stagg, time = year, estimator = "cs")
Callaway & Sant’Anna (2021) — estimator = "cs"
CS runs on a balanced panel: rows with missing values and units not observed in every period are dropped with a warning, as did::att_gt() does by default.
cs <- event_study(
  y ~ 1 | id + year,
  data          = df_stagg,
  time          = year,
  timing        = timing,
  estimator     = "cs",
  control_group = "nevertreated"
)

print(cs)
## Event Study Result (fixes)
## N: 950 | Units: 95 | Treated units: 45 | Never-treated: 50
## Panel: unit = id | time = year
## FE:
## VCOV: analytic | Cluster: -
## Estimator: cs
## Method: classic | lead_range: 9 lag_range: 8 baseline: -1
plot(cs)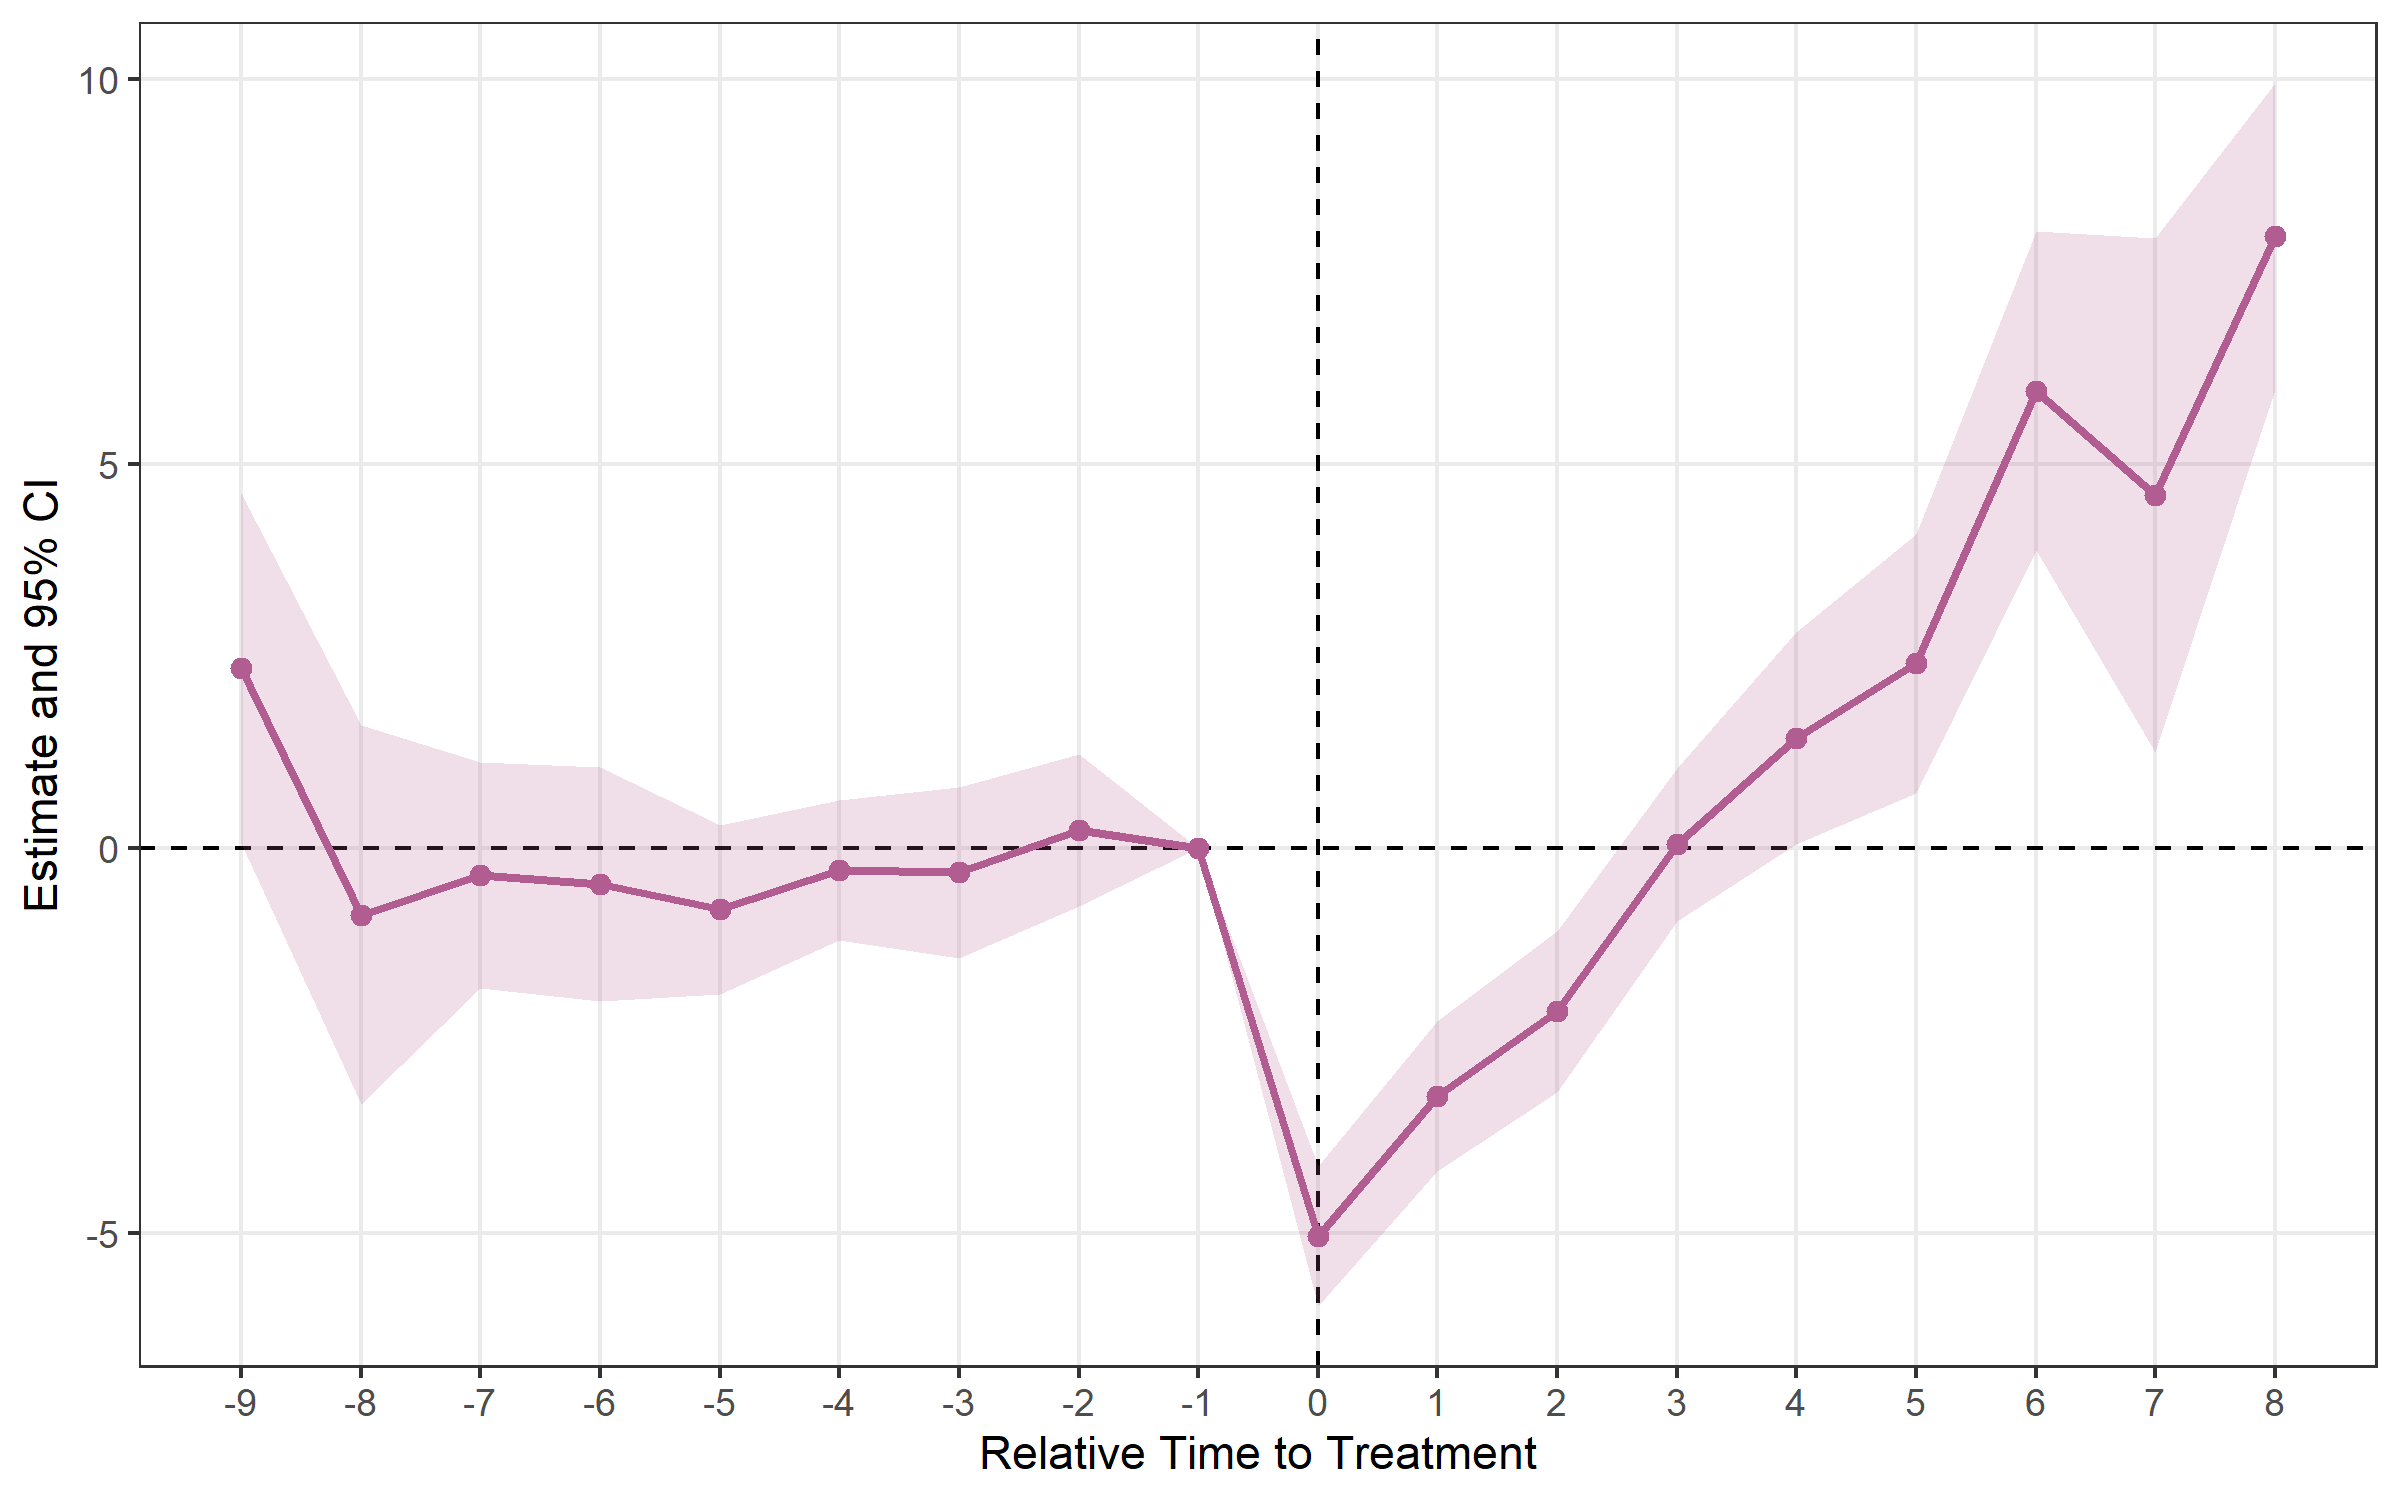
Sun & Abraham (2021) — estimator = "sa"
sa <- event_study(
  y ~ 1 | id + year,
  data      = df_stagg,
  time      = year,
  timing    = timing,
  estimator = "sa",
  cluster   = ~ id
)

print(sa)
## Event Study Result (fixes)
## N: 950 | Units: 95 | Treated units: 45 | Never-treated: 50
## Panel: unit = id | time = year
## FE: id + year
## VCOV: HC1 | Cluster: id
## Estimator: sa
## Method: classic | lead_range: 9 lag_range: 8 baseline: -1
plot(sa)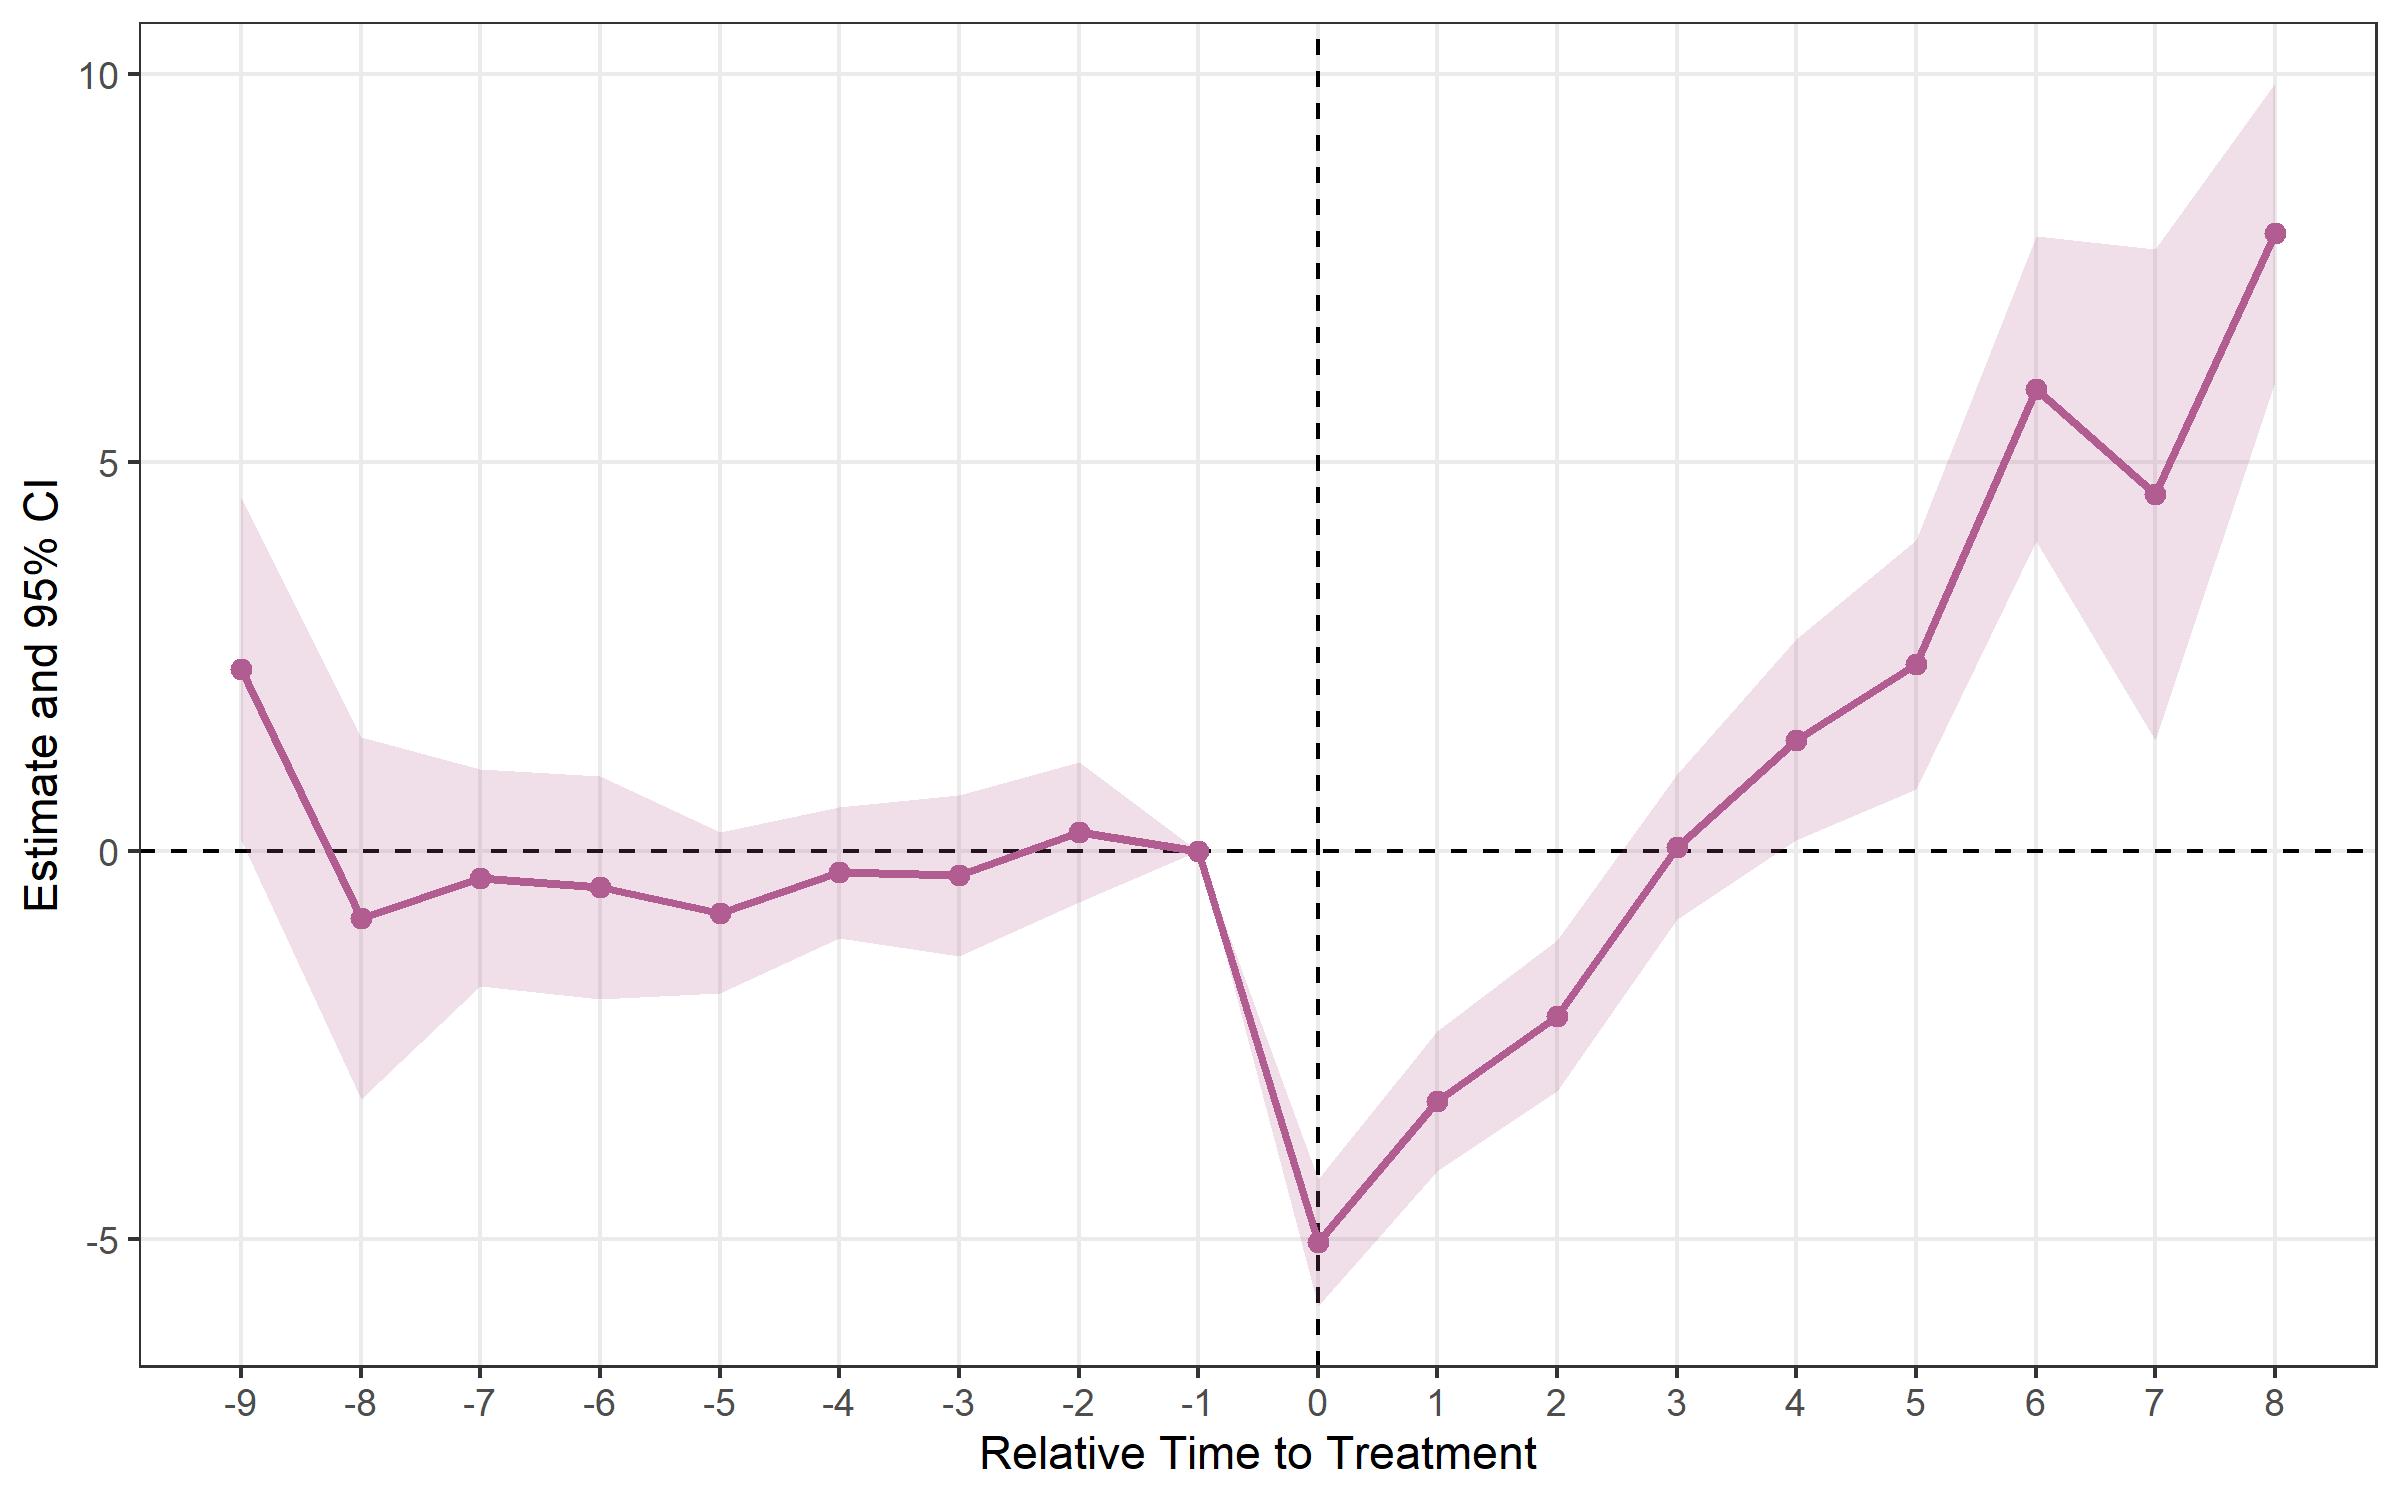
Borusyak, Jaravel & Spiess (2024) — estimator = "bjs"
bjs <- event_study(
  y ~ 1 | id + year,
  data      = df_stagg,
  time      = year,
  timing    = timing,
  estimator = "bjs"
)

print(bjs)
## Event Study Result (fixes)
## N: 950 | Units: 95 | Treated units: 45 | Never-treated: 50
## Panel: unit = id | time = year
## FE: id + year
## VCOV: bjs_conservative | Cluster: -
## Estimator: bjs
## Method: classic | lead_range: 1 lag_range: 8 baseline: -1
plot(bjs)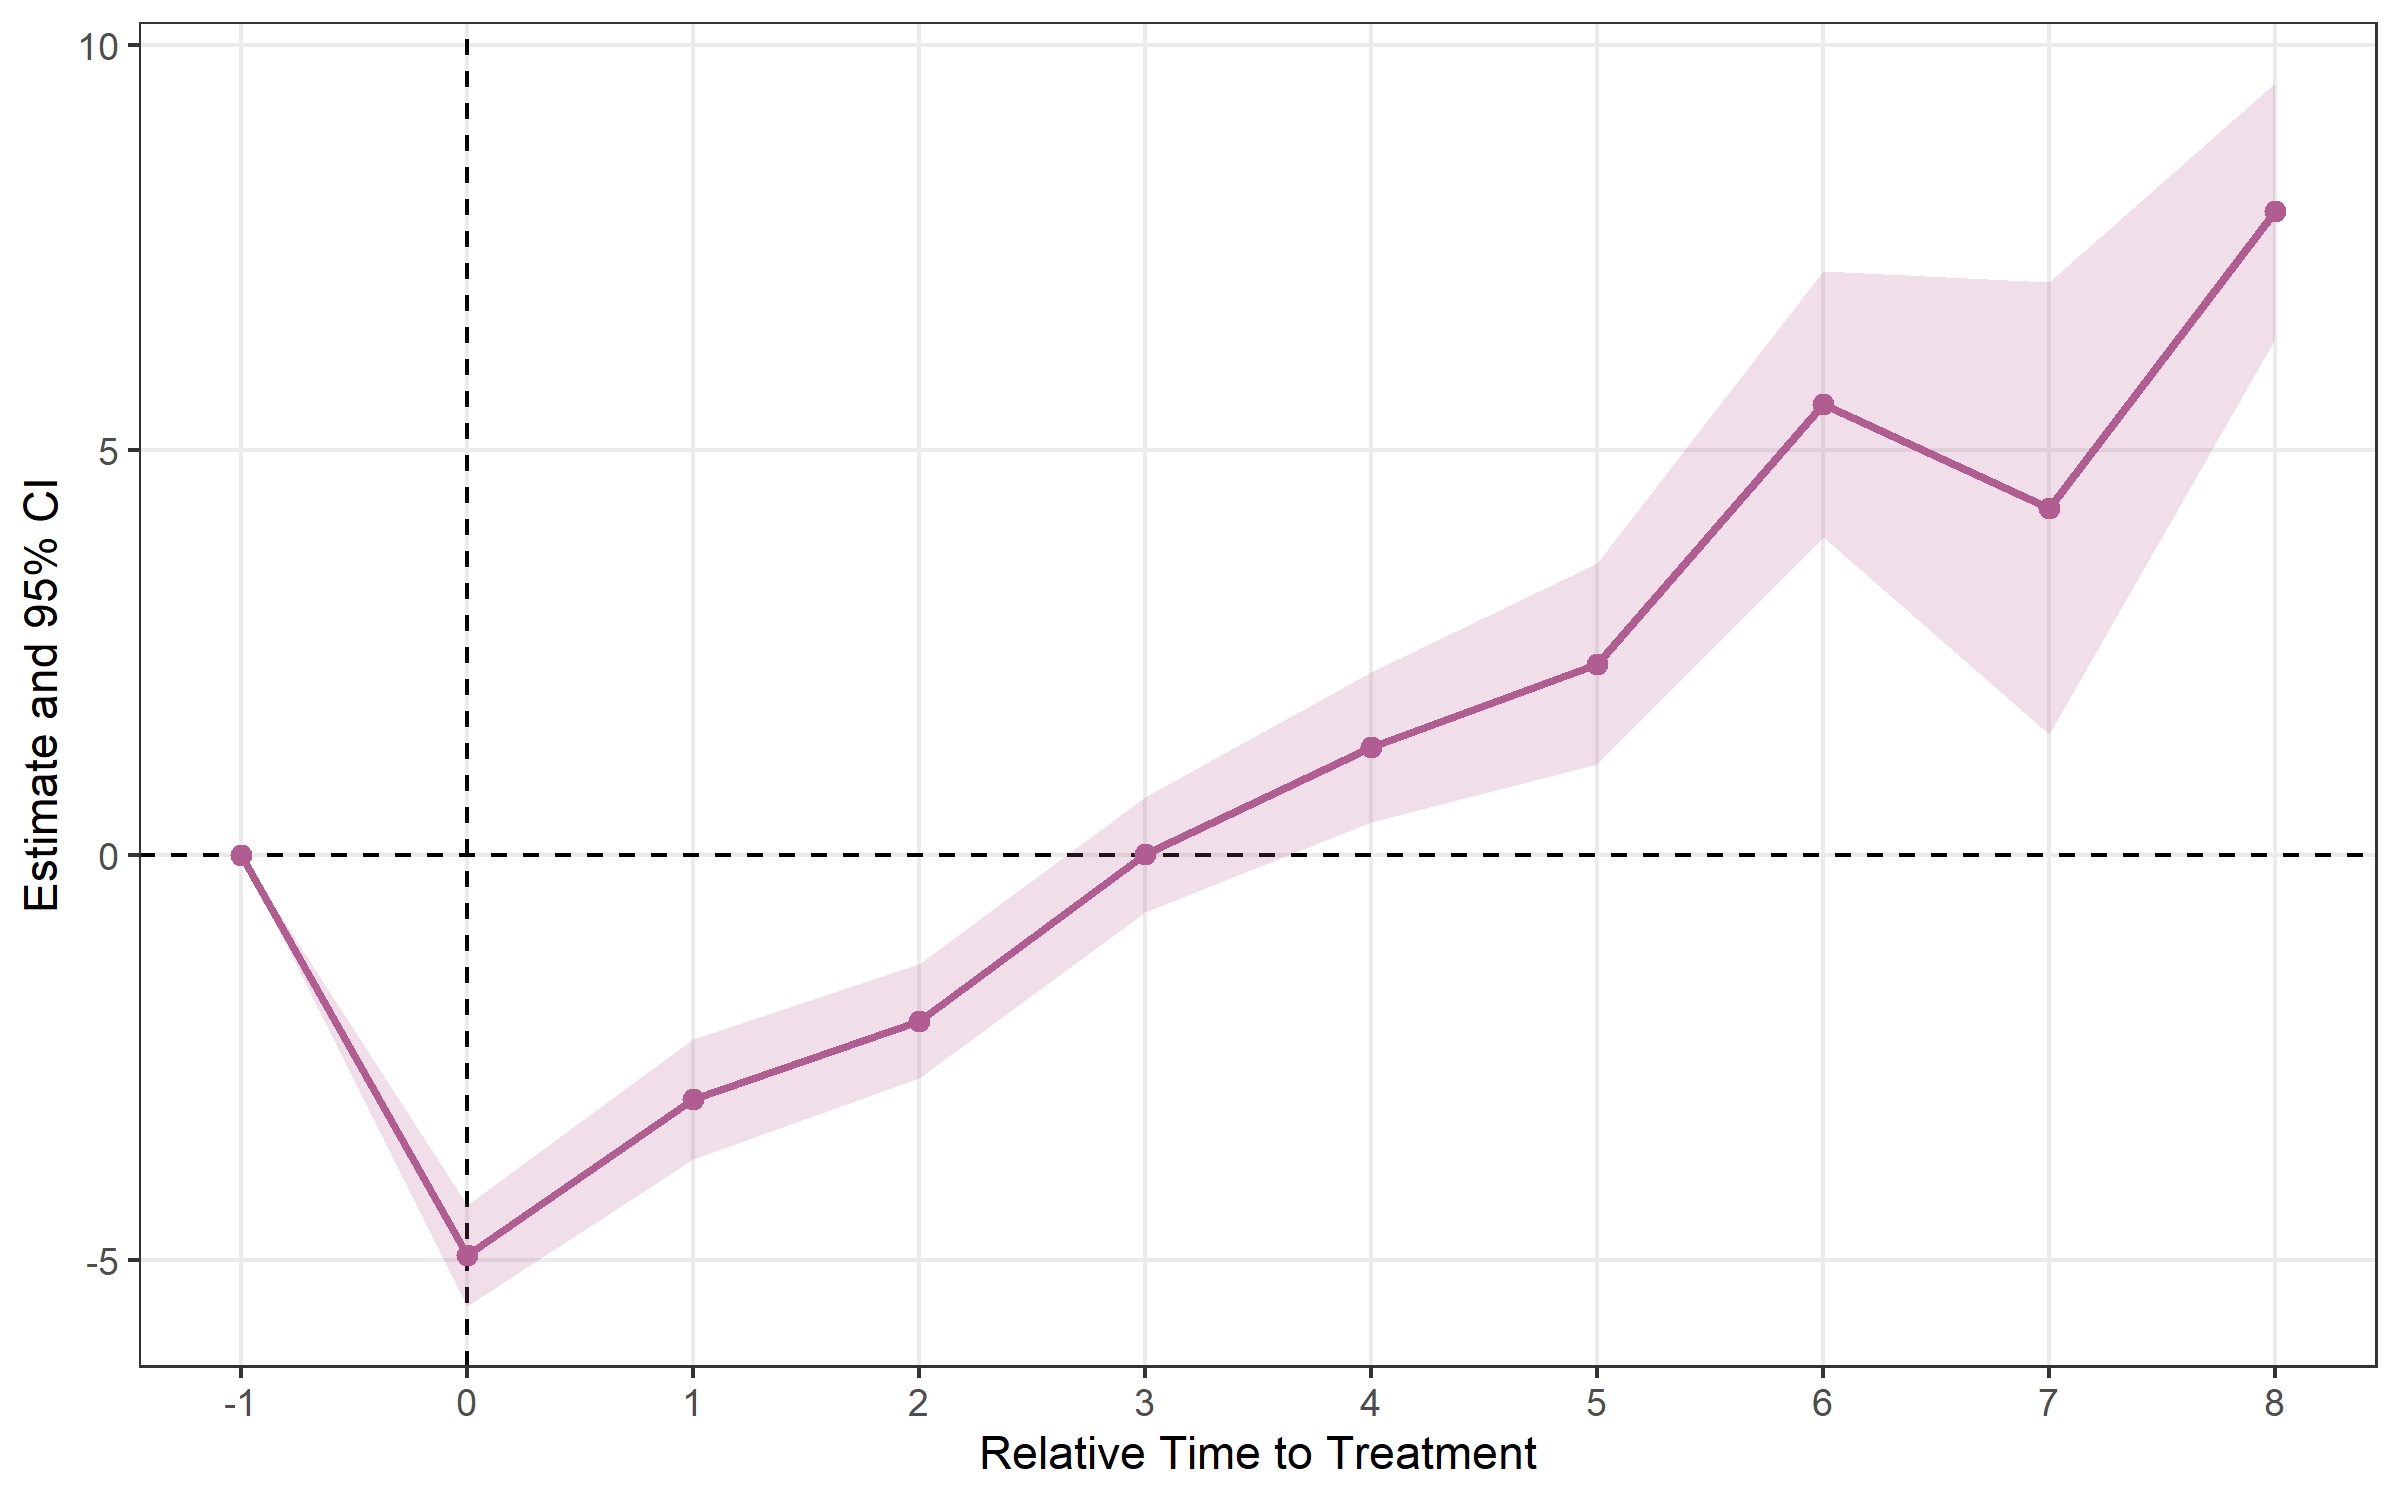
Wooldridge (2025) Two-Way Mundlak — estimator = "twm"
Algebraically equivalent to Sun-Abraham in the base case. trends = TRUE adds cohort-specific linear trend regressors to absorb differential pre-trends (output shows relative_time ≥ 0 only).
twm <- event_study(
  y ~ 1 | id + year,
  data      = df_stagg,
  time      = year,
  timing    = timing,
  estimator = "twm"
)

print(twm)
## Event Study Result (fixes)
## N: 950 | Units: 95 | Treated units: 45 | Never-treated: 50
## Panel: unit = id | time = year
## FE: id + year
## VCOV: HC1 | Cluster: -
## Estimator: twm
## Method: classic | lead_range: 9 lag_range: 8 baseline: -1
plot(twm)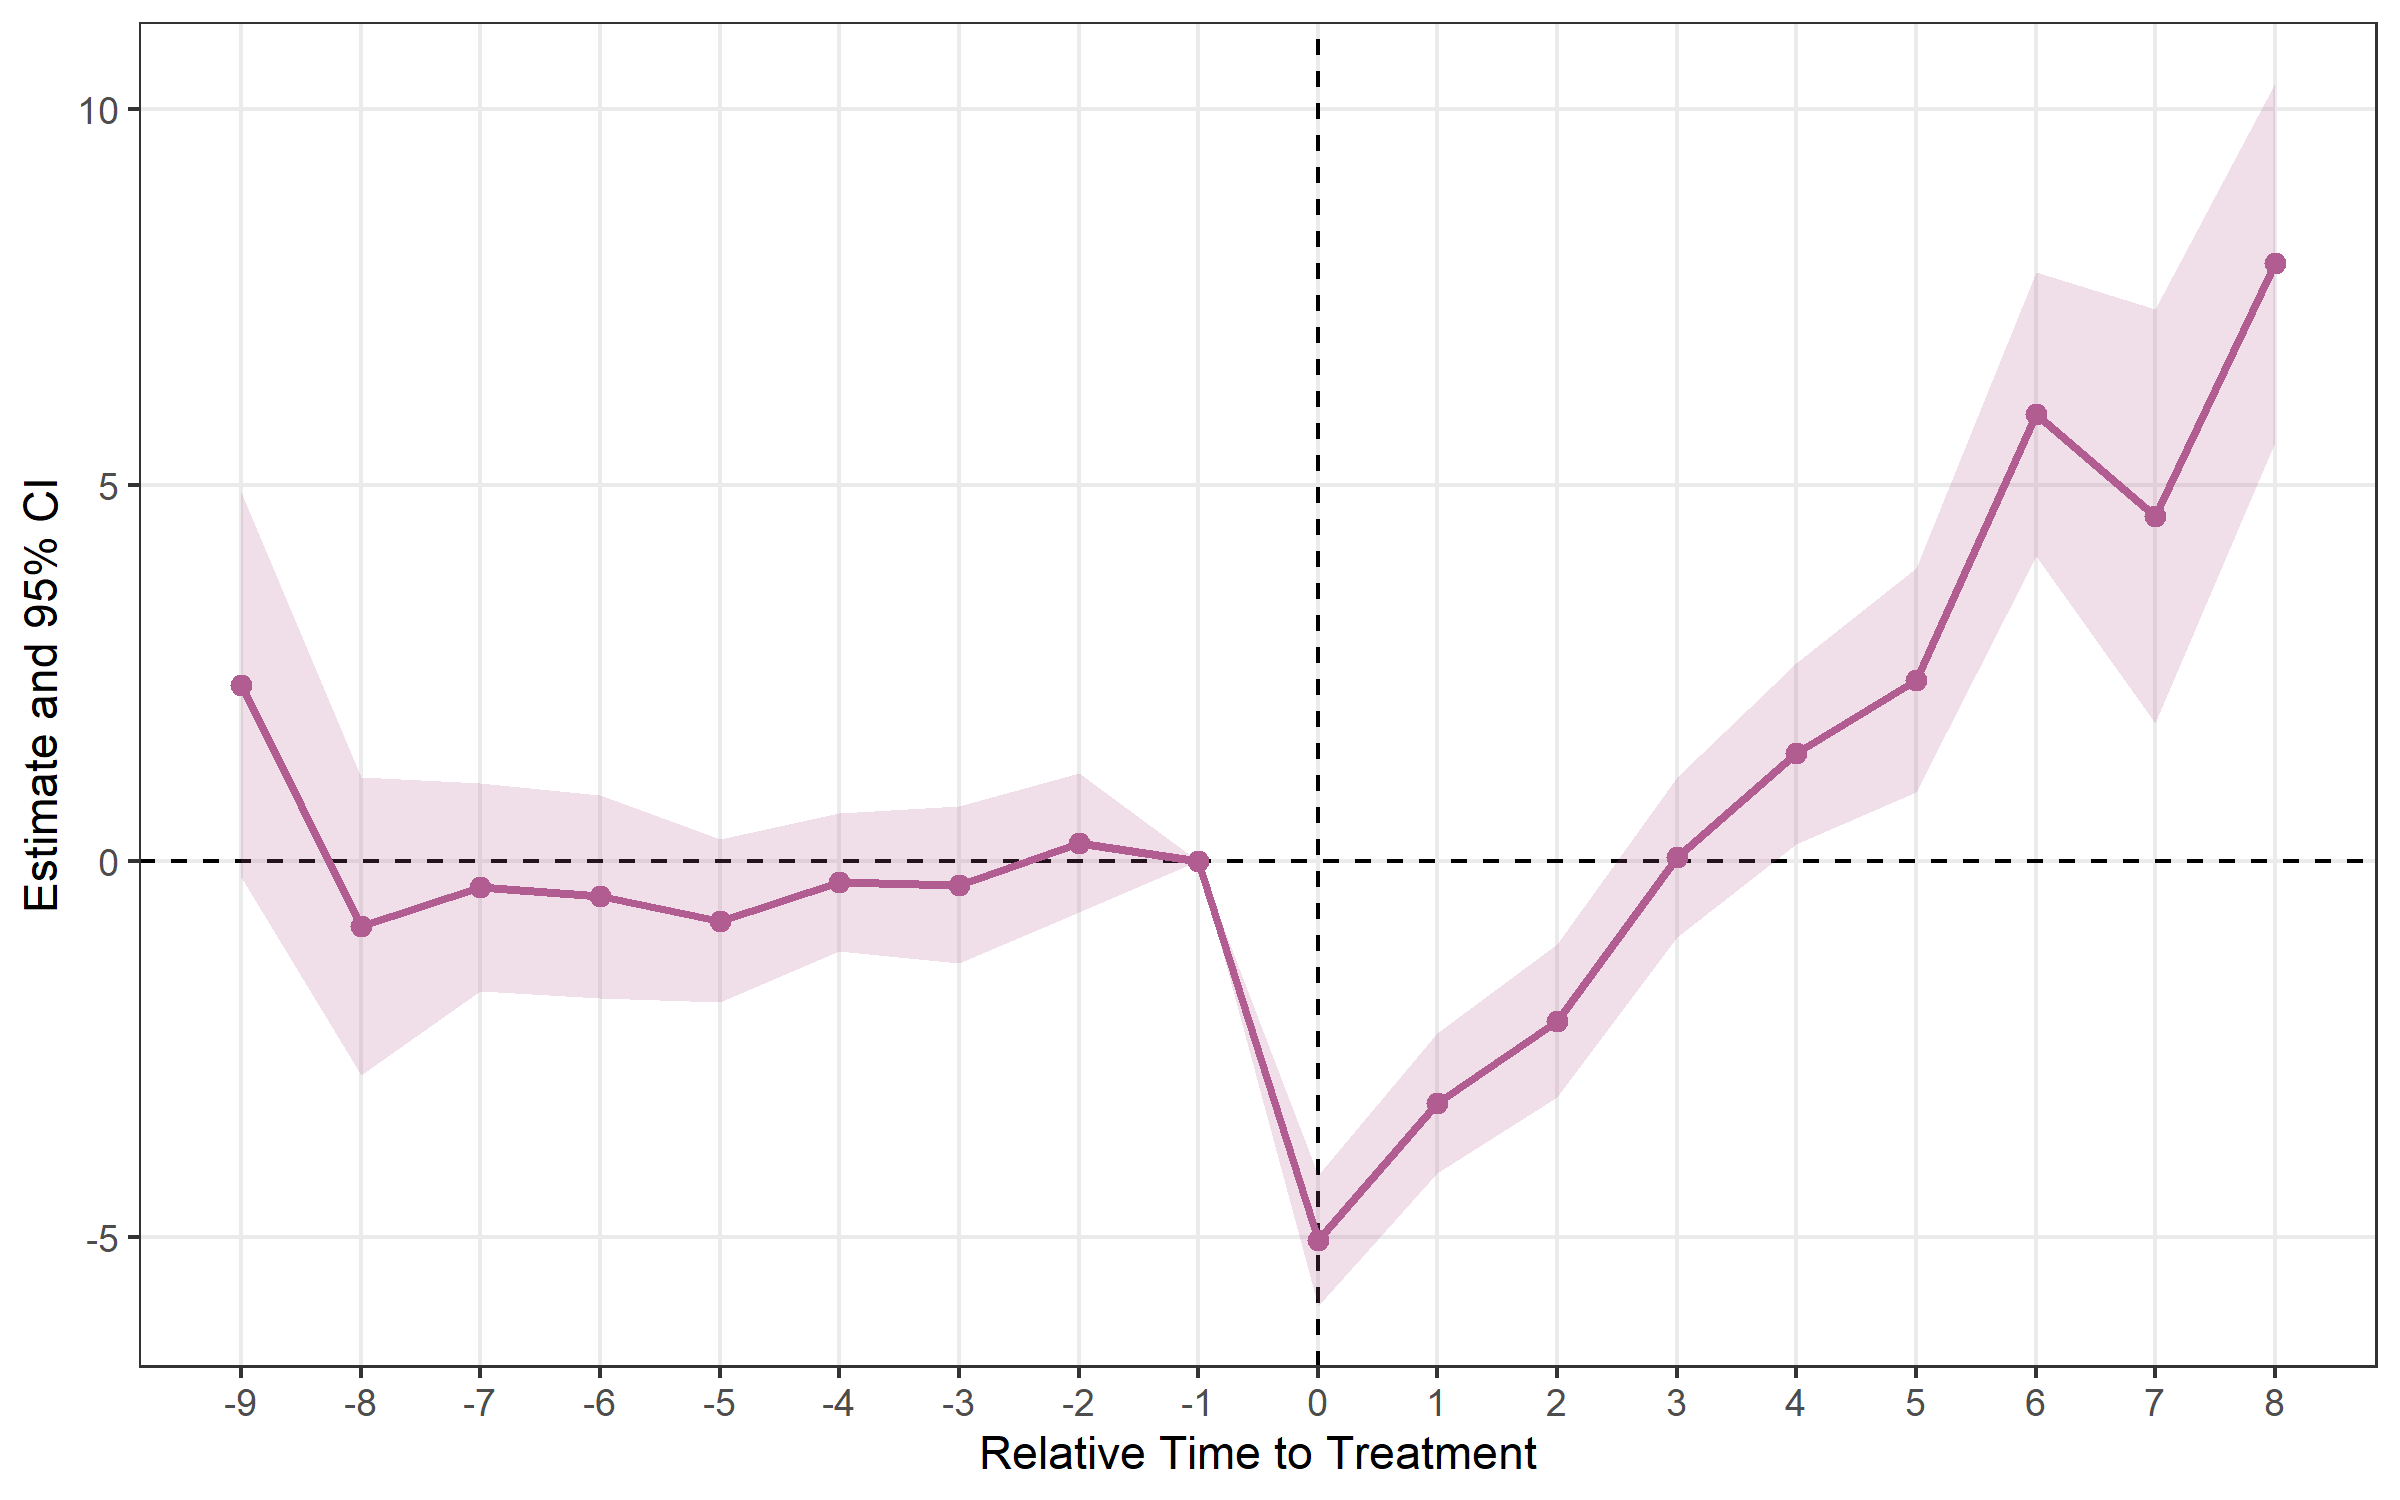
Deb, Norton, Wooldridge & Zabel (2024) FLEX — estimator = "flex"
Designed for repeated cross-section data (different individuals each period). Requires a group argument identifying the treatment group each observation belongs to.
flex <- event_study(
  y ~ 1,
  data      = df_rcs,
  time      = year,
  timing    = timing,
  group     = group_id,
  estimator = "flex"
)

plot(flex)
ATT aggregation — att()
After estimating event_study() with a staggered estimator, att() computes a single aggregated ATT — or one per cohort / per calendar period.
# Overall ATT
att_simple <- att(
  y ~ 1 | id + year,
  data        = df_stagg,
  time        = year,
  timing      = timing,
  estimator   = "cs",
  aggregation = "simple"
)

print(att_simple)
## ATT Estimation [estimator: CS | aggregation: Simple (overall)]
## N = 950 obs | 95 units | 45 treated
## Panel: unit = id | time = year
##
## group estimate std.error statistic p.value conf_low_95 conf_high_95
## 1 NA -0.755 0.679 -1.11 0.266 -2.09 0.576
# Per-cohort ATT
att(y ~ 1 | id + year, data = df_stagg, time = year, timing = timing,
    estimator = "cs", aggregation = "by_cohort")

# Per-calendar-period ATT
att(y ~ 1 | id + year, data = df_stagg, time = year, timing = timing,
    estimator = "cs", aggregation = "by_time")
Supported estimators for att(): "cs" (Callaway-Sant’Anna 2021) and "bjs" (Borusyak et al. 2024).
Bootstrap simultaneous confidence bands
Pointwise CIs control error rates one period at a time. When you plot 15 pre- and post-treatment estimates, the joint false-positive rate may exceed 5 %. Simultaneous bands (Callaway & Sant’Anna 2021, Corollary 1) provide joint coverage across the entire event-study curve.
cs_boot <- event_study(
  y ~ 1 | id + year,
  data          = df_stagg,
  time          = year,
  timing        = timing,
  estimator     = "cs",
  control_group = "nevertreated",
  bootstrap     = TRUE,
  boot_reps     = 999,
  boot_seed     = 42
)
# Lighter outer band = simultaneous CI; darker inner band = pointwise CI
plot(cs_boot, show_simultaneous = TRUE)
plot(cs_boot, interactive = TRUE, show_simultaneous = TRUE)Honest sensitivity analysis — honest_sensitivity()
Event-study estimates rely on the parallel trends assumption. Rather than testing pre-trends and hoping for the best, honest_sensitivity() implements Rambachan & Roth (2023): it reports confidence sets for a post-treatment effect under progressively weaker restrictions on how different post-treatment violations of parallel trends can be from the pre-trends, plus a breakdown value — the largest violation at which the effect is still significant.
res <- event_study(y ~ treat | id + year, data = df, time = year, timing = 6)

# Relative-magnitude restriction: post violation <= Mbar x max pre violation
h <- honest_sensitivity(res, type = "relative_magnitude",
                        m_grid = c(0, 0.5, 1, 1.5, 2))
print(h)          # robust CIs per Mbar + the original (parallel-trends) CI
plot(h)    # "top-down" sensitivity plot
Use type = "smoothness" for the (bounded second difference) restriction. Inference uses the Andrews-Roth-Pakes conditional test — a pure-R reimplementation validated against the HonestDiD package. For estimators other than "twfe", pass betahat and sigma directly. The numeric helpers (lpSolveAPI, Rglpk, TruncatedNormal, Matrix, pracma) are optional Suggests.
Plotting options
plot() works with results from any estimator. The default display is black error bars; type = "ribbon" draws a line with a shaded band in the package’s muted steel blue.
plot(es, type = "ribbon")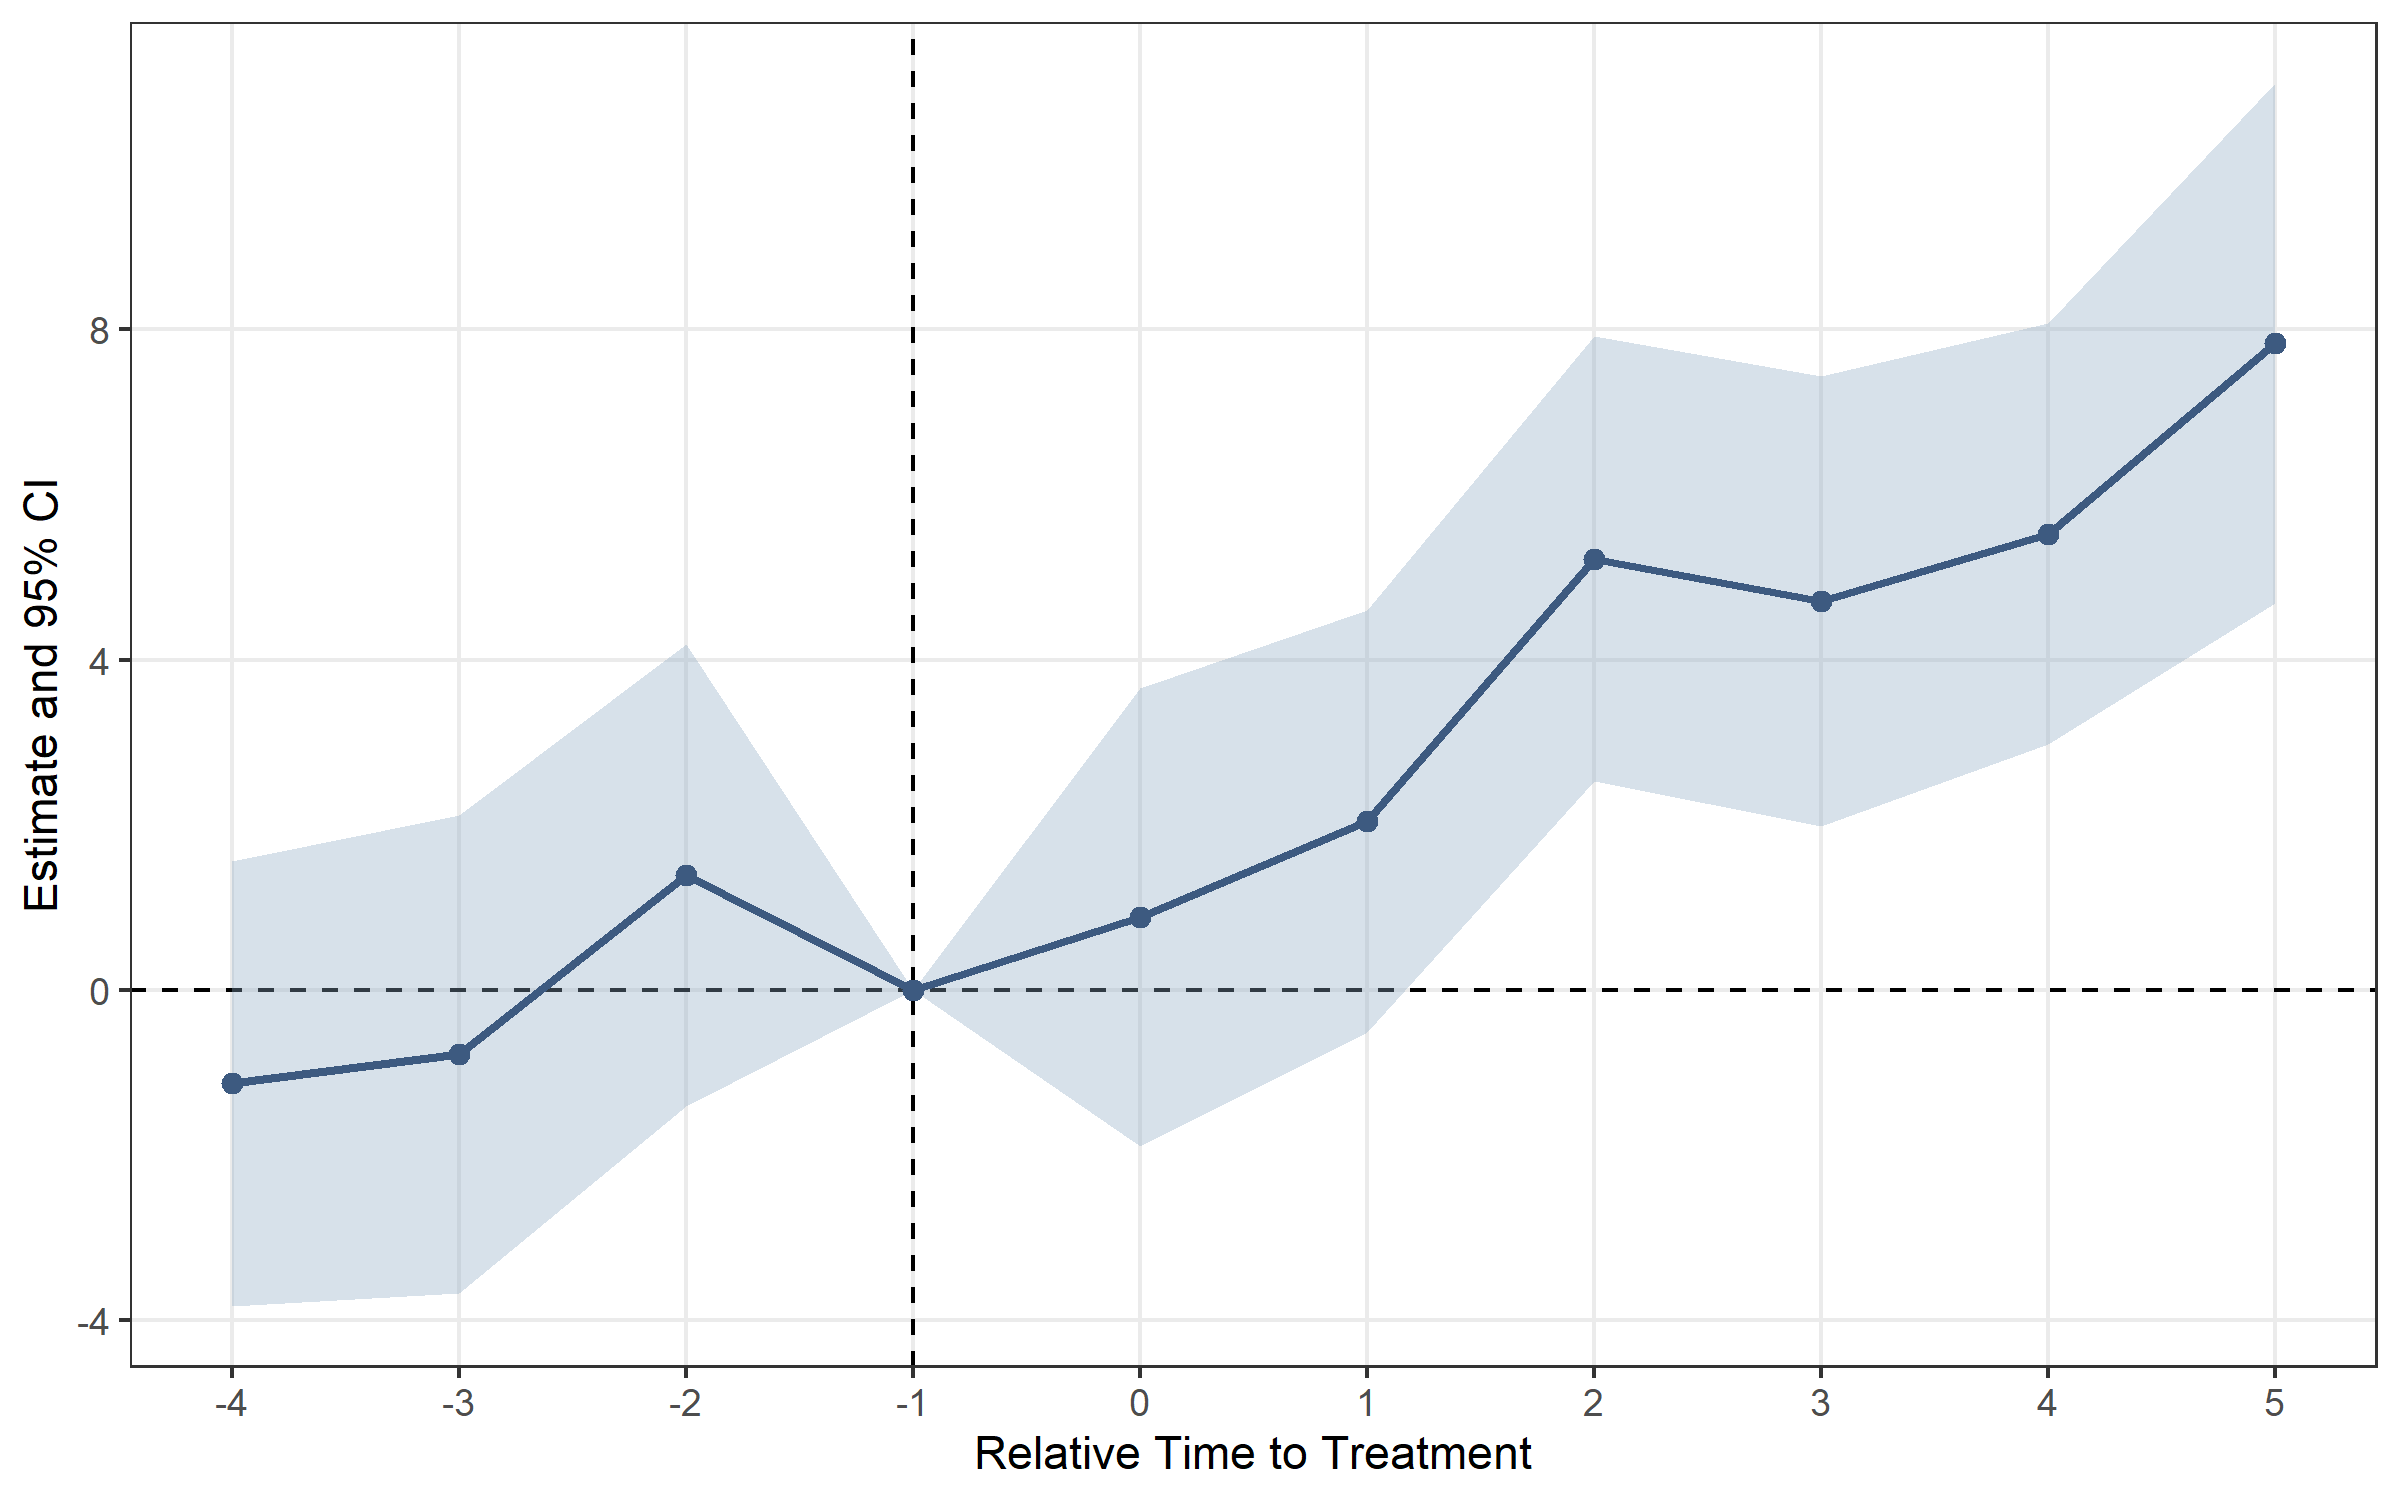
color sets the points (and the ribbon line), fill the band, and errorbar_color recolours the bars on their own — it follows color unless you set it.
plot(es, color = "#1B4965", errorbar_color = "grey60")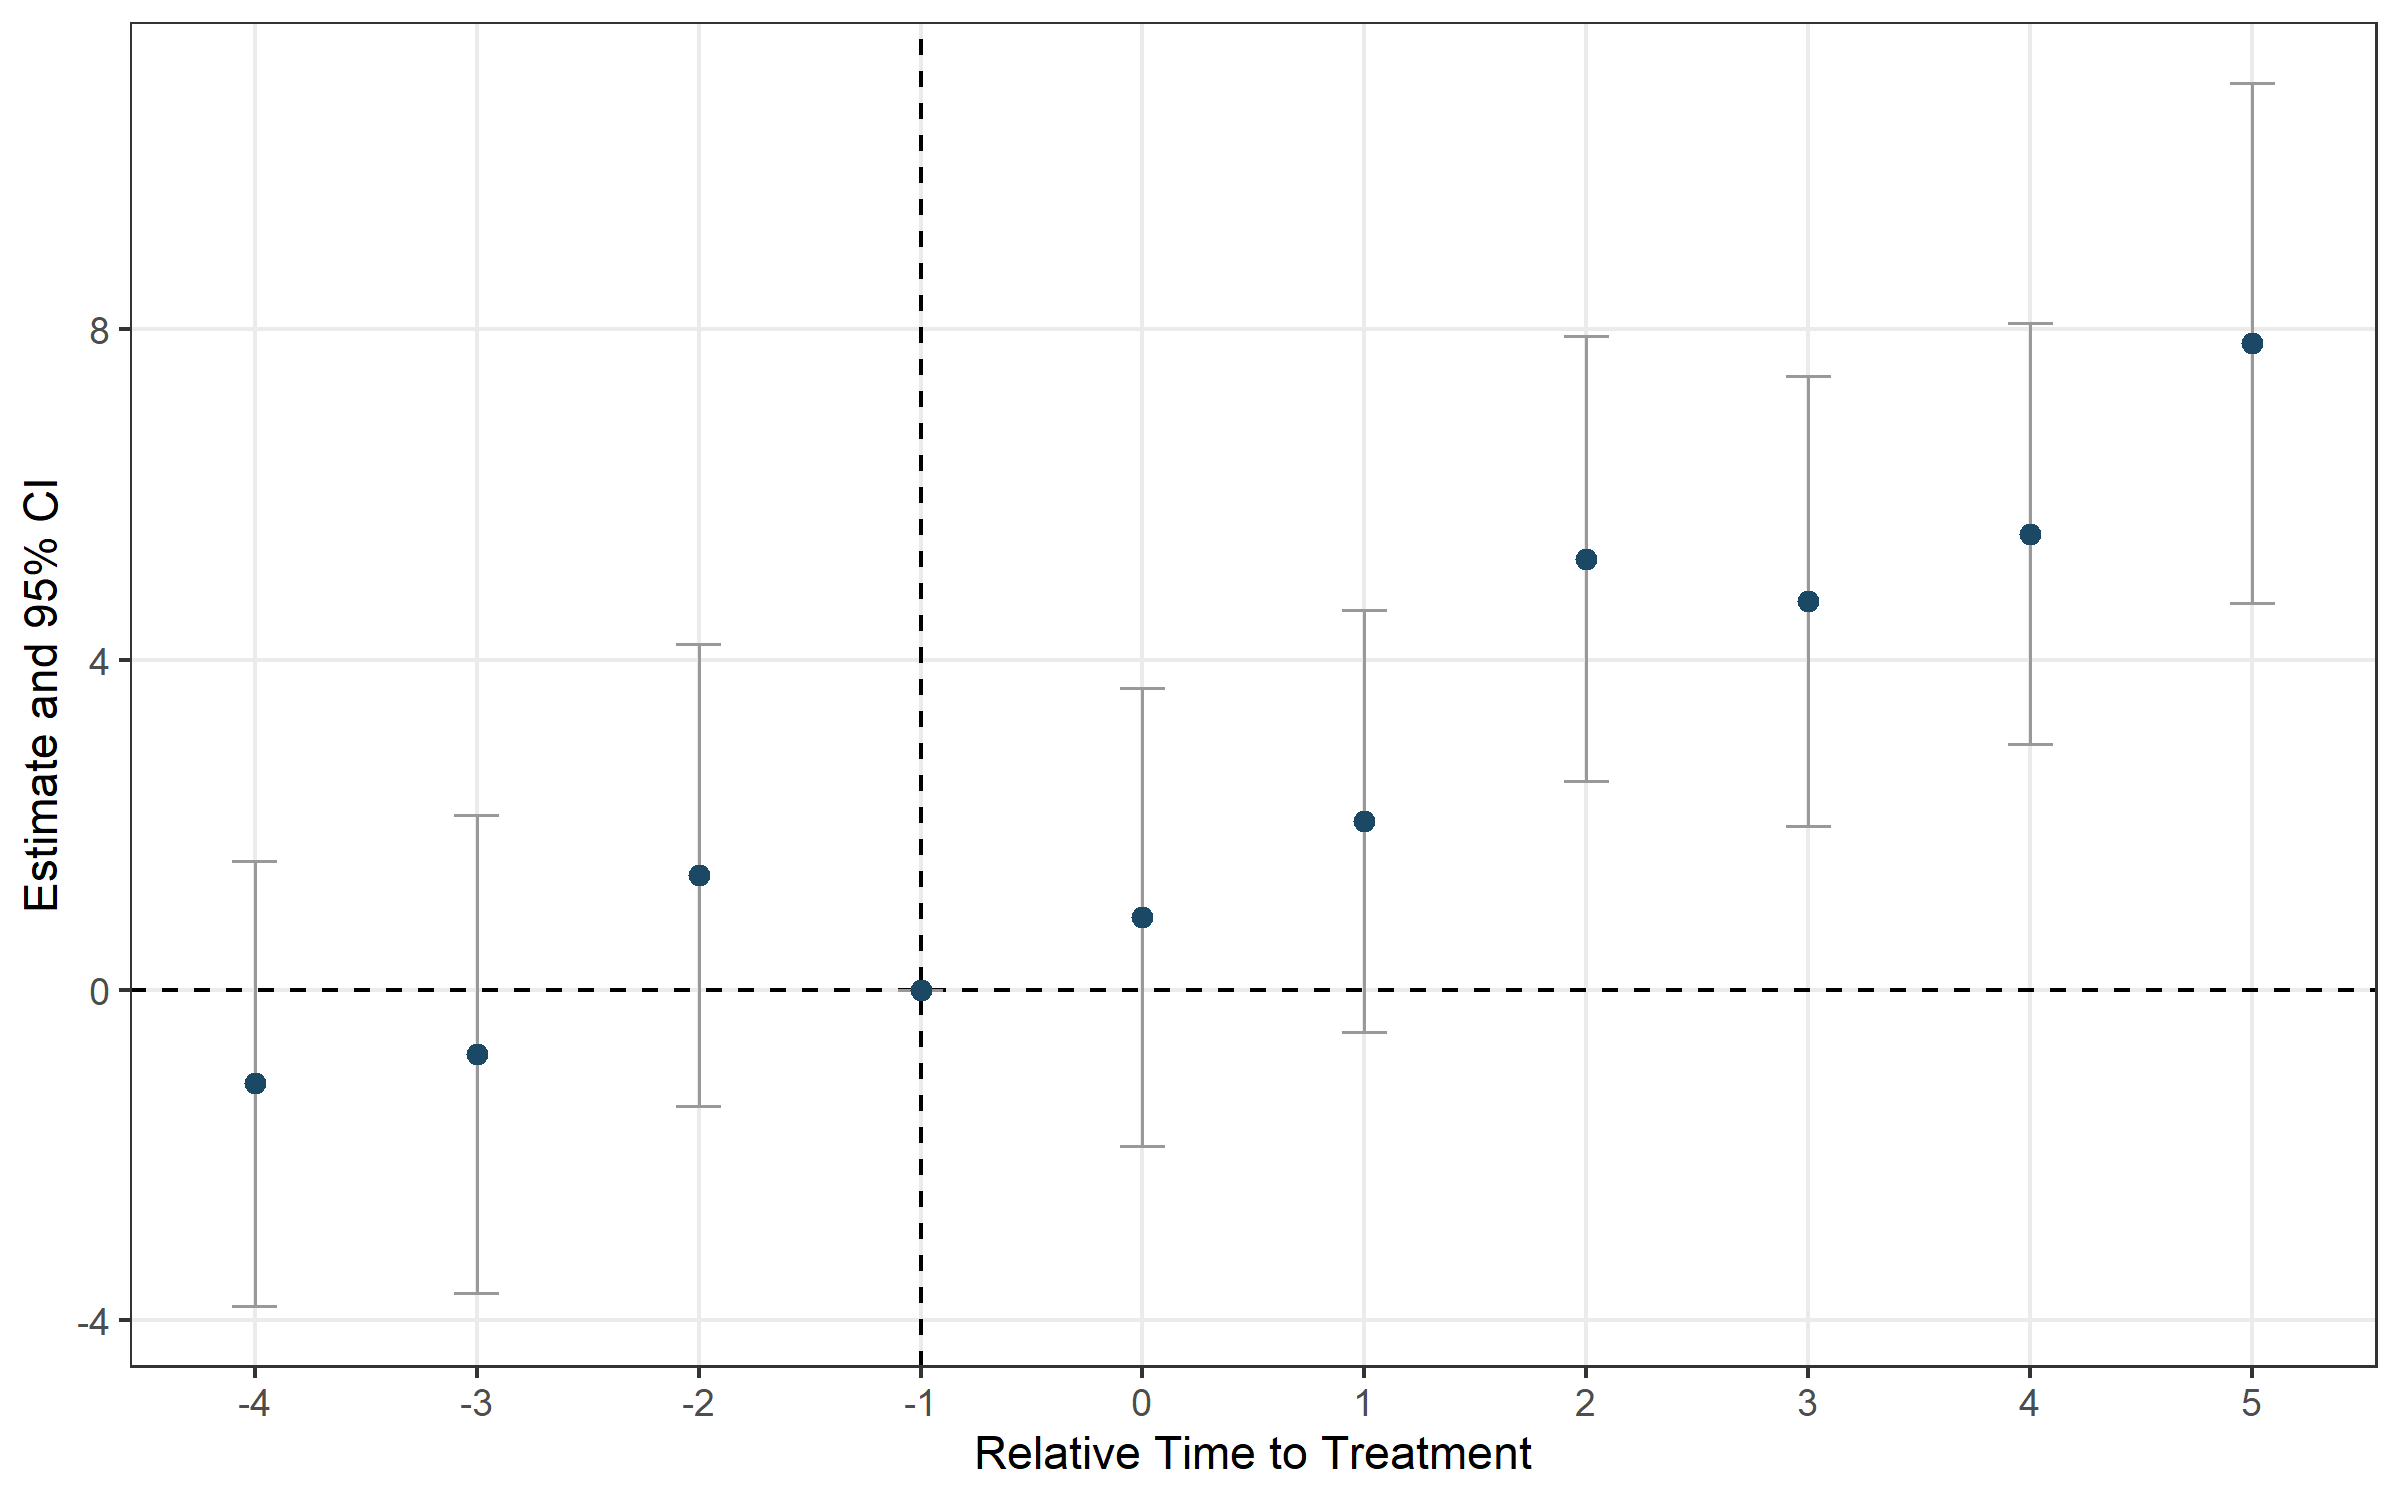
es_multi <- event_study(
  y ~ treat | id + period,
  data       = df,
  time       = period,
  timing     = 5,
  cluster    = ~ id,
  conf_level = c(0.90, 0.95, 0.99)
)
plot(es_multi, ci_level = 0.90, theme_style = "minimal")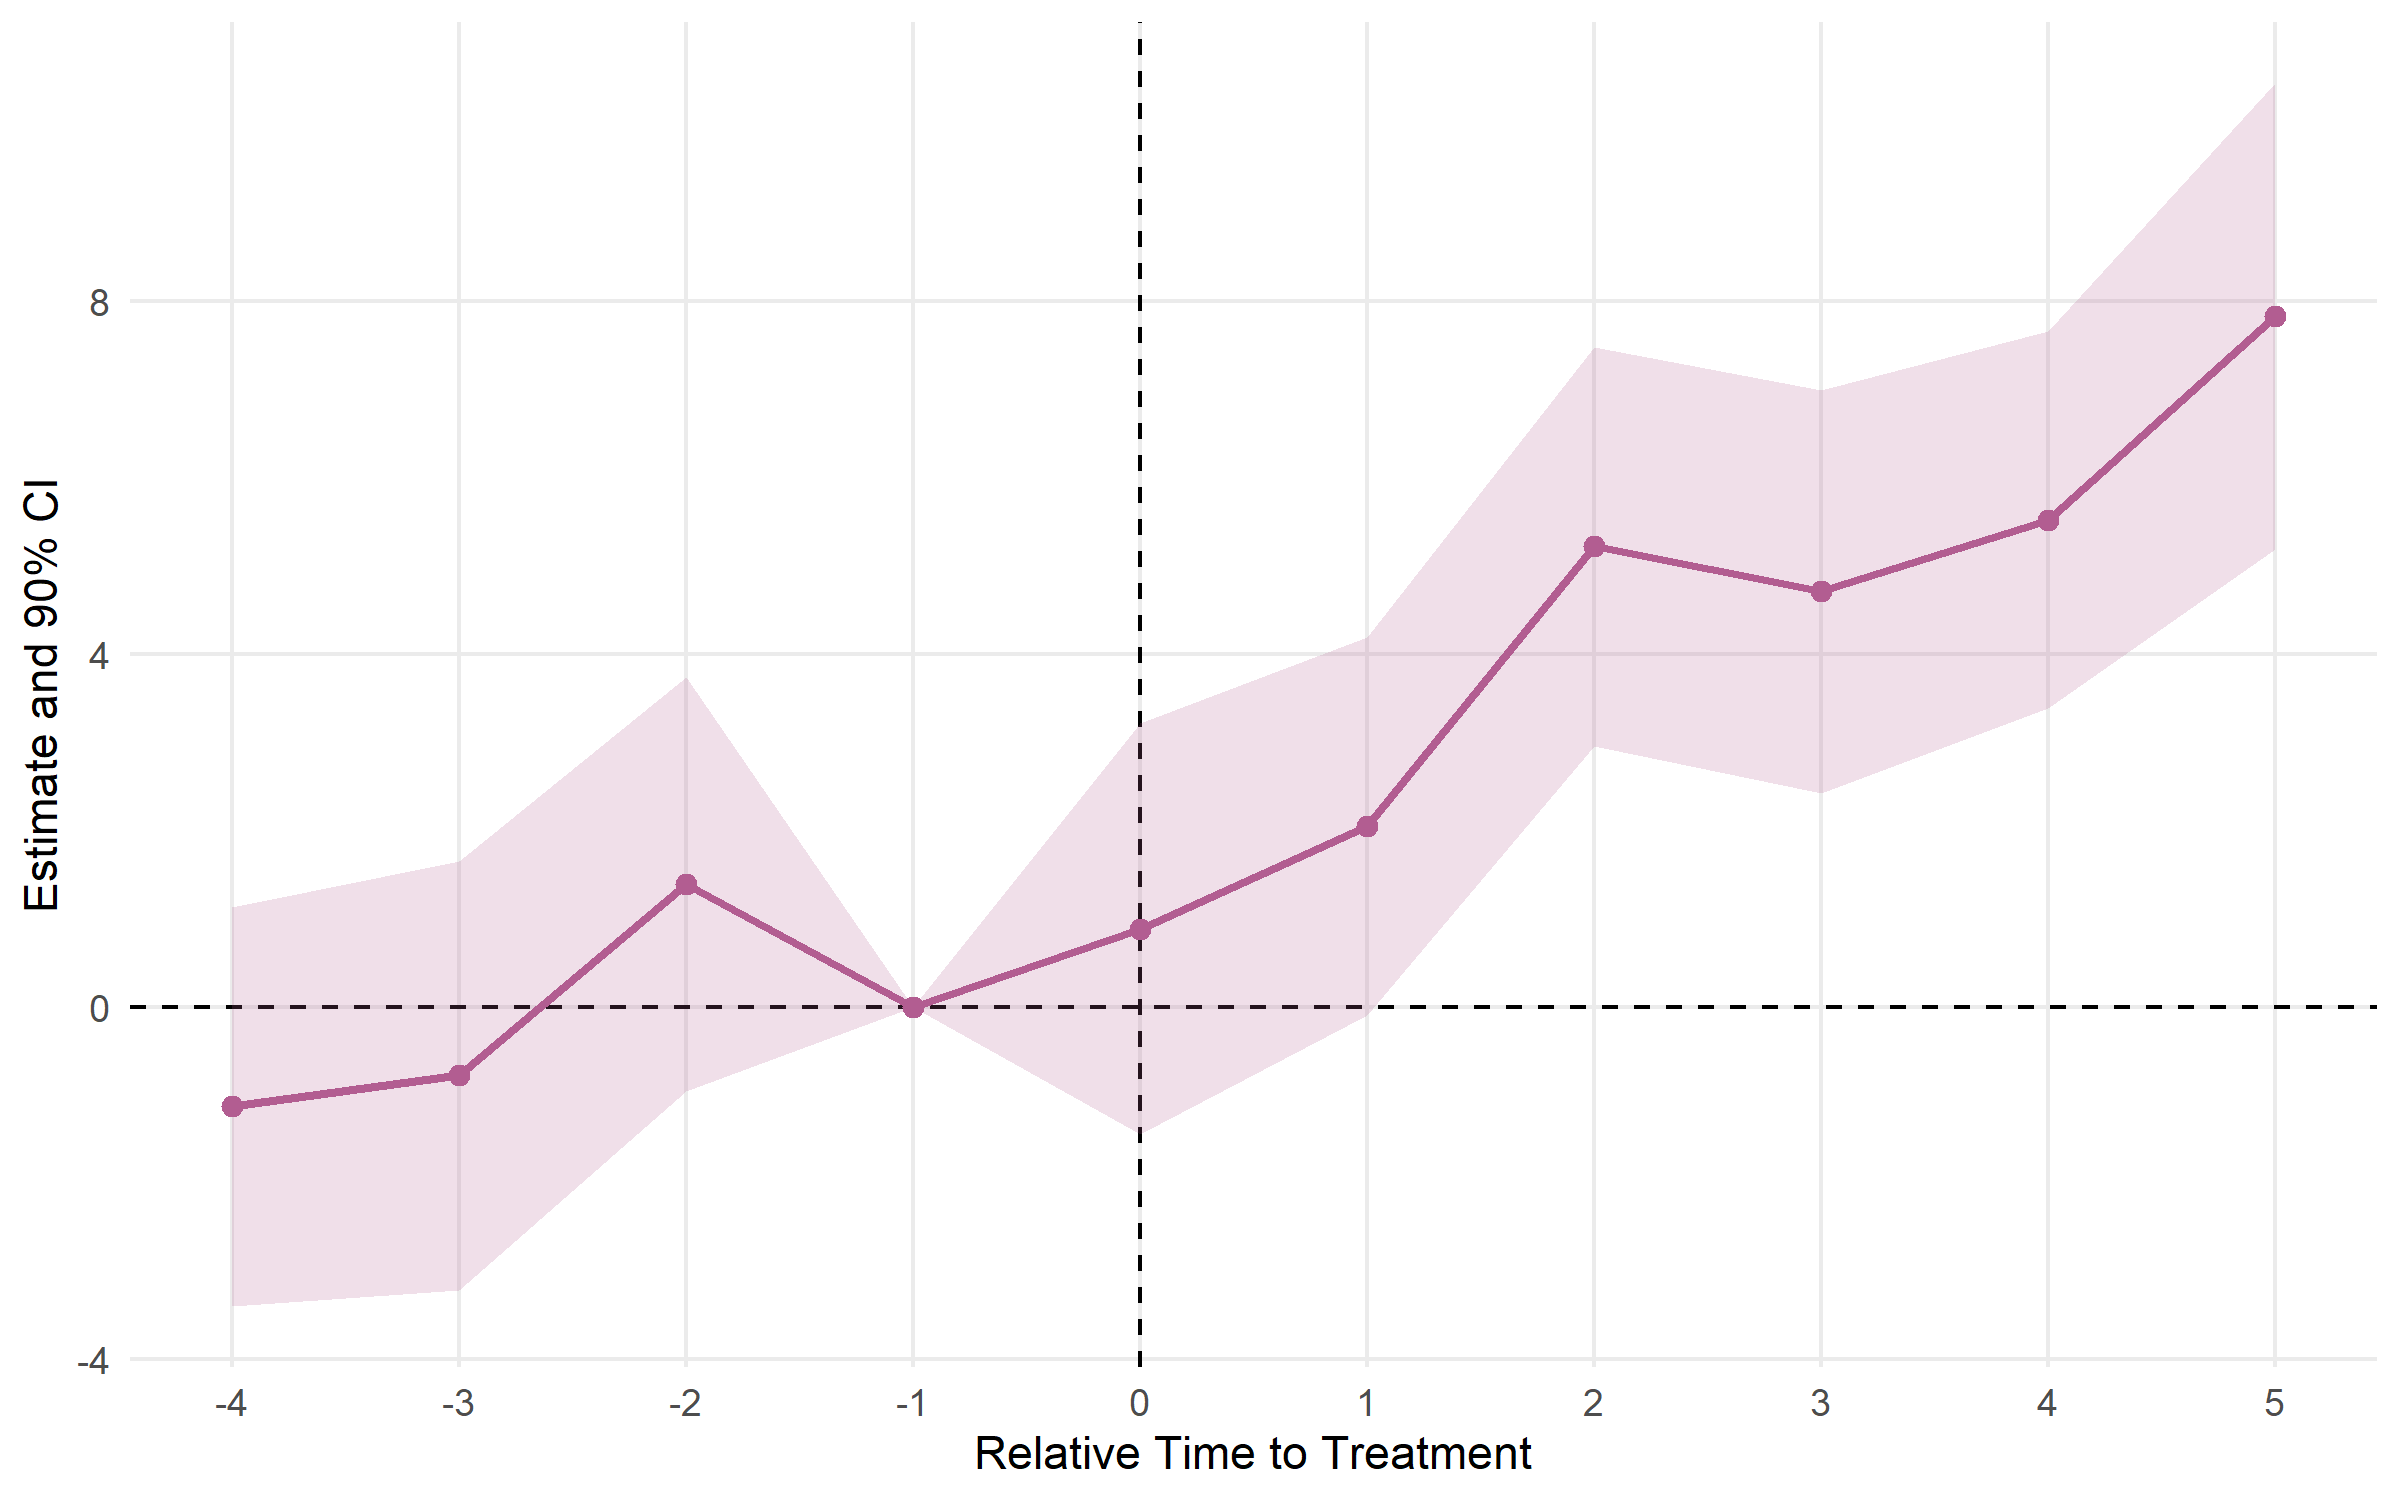
ci_level must be one of the levels the result was estimated at.
The x axis shows event time by default. With time_axis = "calendar" it shows the original time values instead — available for universal timing, not for staggered adoption. The dashed line marks the last pre-treatment period on either axis:
plot(es, time_axis = "calendar")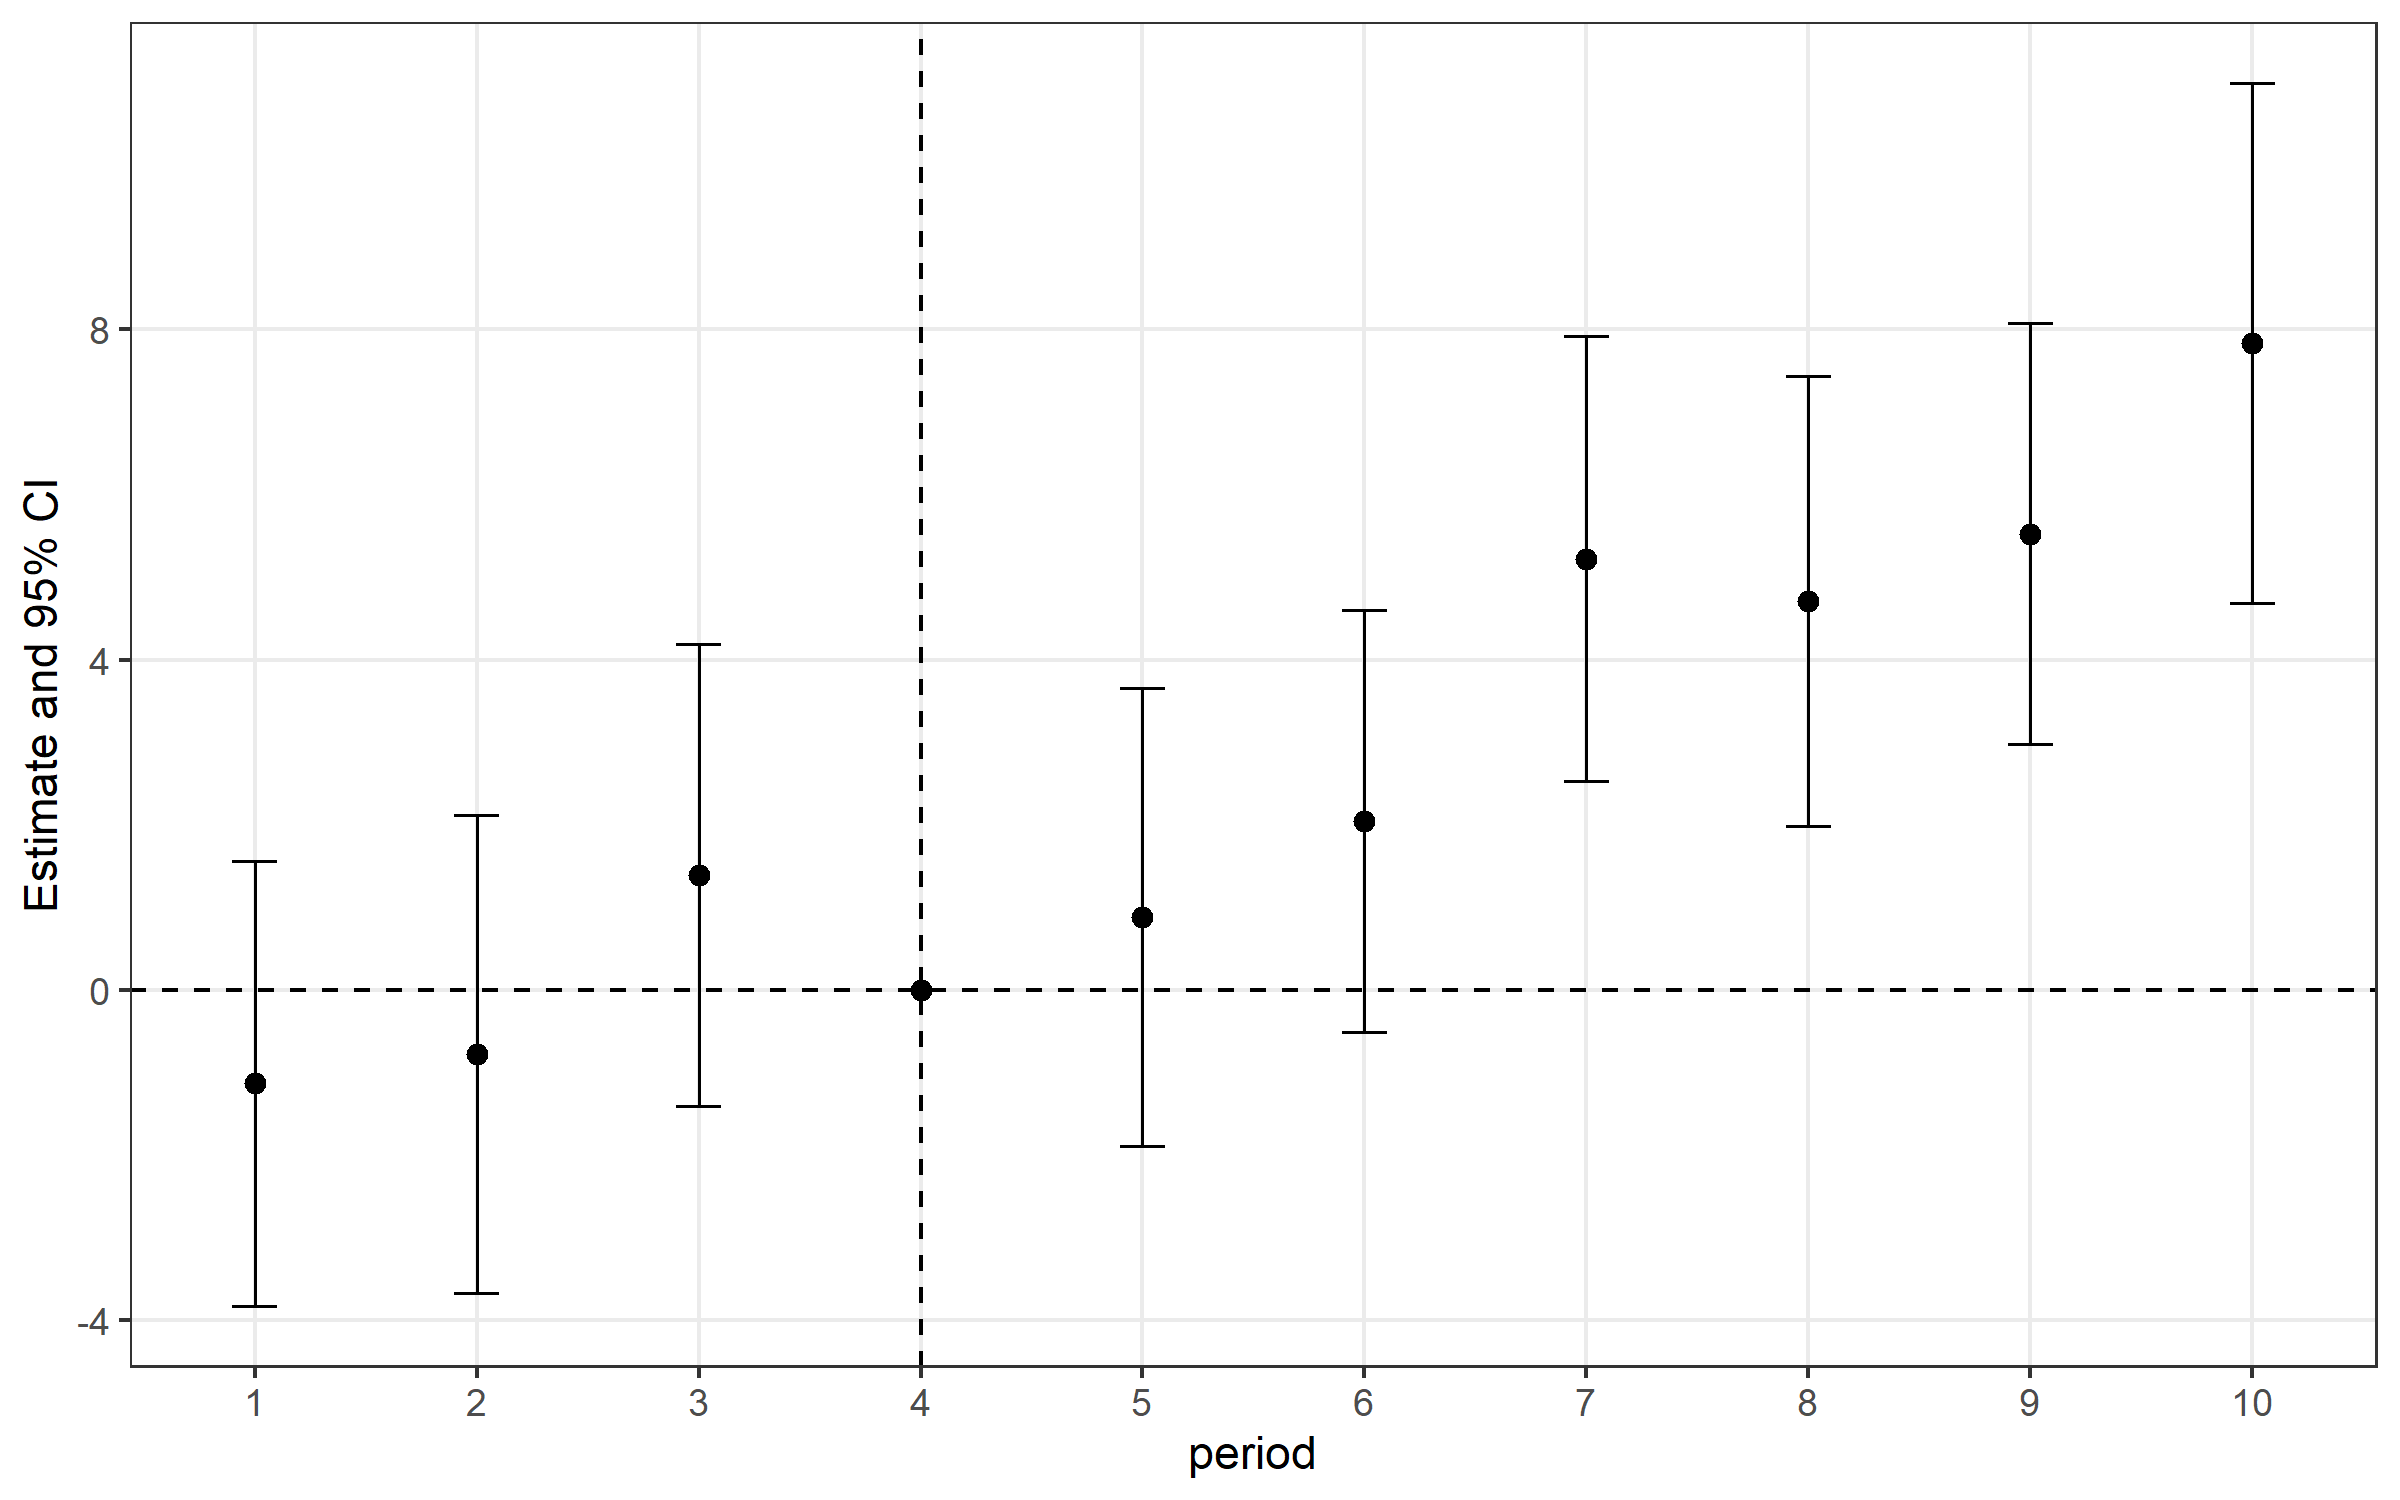
Key arguments
did()
| Argument | Default | Description |
|---|---|---|
formula |
— |
outcome ~ treatment + covariates \| fixed effects; without \| there are no fixed effects |
data |
— | Data frame (panel); may come before formula
|
time |
NULL |
Time variable; required with timing
|
timing |
NULL |
Timing column (NA = never treated) or a single date; omit for a D column |
unit |
NULL |
Unit identifier (sample-size metadata); read from the fixed effects when possible |
cluster |
NULL |
Clustering: formula ~ id, column name, or vector |
conf_level |
0.95 |
CI level(s); vector allowed |
vcov |
"HC1" |
VCOV type; cluster-robust SE used automatically when cluster is set |
event_study()
| Argument | Default | Description |
|---|---|---|
formula |
— |
outcome ~ treatment + covariates \| fixed effects; covariates are supported by "twfe", "twm" and "flex"
|
data |
— | Data frame (panel or RCS); may come before formula
|
time |
— | Time variable (numeric or Date) |
timing |
NULL |
Timing column (NA = never treated; constant within each unit) or a single date; omit for a D column |
unit |
NULL |
Unit ID; read from the fixed effects when they are time plus one column. Needed for "cs", "sa", "bjs", "twm" and for a D column |
estimator |
"twfe" |
"twfe", "cs", "sa", "bjs", "twm", or "flex"
|
staggered |
NULL |
Inferred from how treatment is given; override with TRUE/FALSE
|
group |
NULL |
FLEX only: treatment group identifier |
trends |
FALSE |
TWM only: cohort-specific linear trends |
control_group |
"nevertreated" |
CS only: "nevertreated" or "notyettreated"
|
cluster |
NULL |
Clustering formula, e.g. ~ id
|
baseline |
-1 |
Reference period |
conf_level |
0.95 |
CI level(s); vector allowed |
vcov |
"HC1" |
VCOV type |
bootstrap |
FALSE |
CS only: multiplier bootstrap for simultaneous CIs |
boot_reps |
999 |
Bootstrap draws |
boot_seed |
NULL |
Bootstrap RNG seed |
att()
| Argument | Default | Description |
|---|---|---|
formula |
— |
outcome ~ treatment \| fixed effects (no covariates) |
data |
— | Data frame (panel); may come before formula
|
time |
— | Calendar time variable |
timing |
NULL |
Timing column (NA = never treated; constant within each unit) or a single date; omit for a D column |
unit |
NULL |
Unit identifier; read from the fixed effects when possible |
estimator |
"cs" |
"cs" or "bjs"
|
aggregation |
"simple" |
"simple", "by_cohort", or "by_time"
|
control_group |
"nevertreated" |
CS only |
conf_level |
0.95 |
CI level(s) |
Contributing
Found a bug or have a feature request? Open an issue on GitHub.